Map Information:
|
Map Title: |
An Evaluation of Six Groundwater-quality Parameters Collected Under NJ's Private Well Testing Act |
|
Name(s) of Author(s): |
Nick Procopio, Judy Louis, Tom Atherholt |
|
Organization: |
NJDEP Office of Science |
|
Email Address: |
nick.procopio@dep.state.nj.us |
|
Software Used to Make Map: |
ArcGIS |
|
Data Sources: |
DEPView, NJ Private Well Testing Act |
|
Map Description: |
This map was developed to provide a visual assessment of the variability of certain water-quality parameters in New Jersey's groundwater. New Jersey's Private Well Testing Act (PWTA) was passed in March 2001 and sampling commenced in September 2002. It is the nation's first statewide program and among only a few state-run programs. In an effort to protect human health, the Act requires that source water from private wells be tested before the closing of any real-estate transaction or new lease agreement. The Act requires the testing of various water-quality parameters, thirty-two of which are "primary" parameters of human health concern along with three non health-related "secondary" parameters. The data is electronically submitted to the NJDEP by the buyer- or seller-contracted laboratories. The NJDEP uses the data collected to evaluate groundwater quality throughout the State and to inform municipalities, counties, and other government entities of potential hazards. The number of individual wells sampled throughout the state varies by parameter. This poster presents the data of three primary (nitrate/nitrite, arsenic, and radionuclides) and three secondary (pH, iron, and manganese) parameters, all naturally occurring, collected from samples collected between September 2002 and January 2011. The results show the variability in the concentration of each parameter throughout New Jersey or specific region where its analysis is required. |
| |
|
Map Title: |
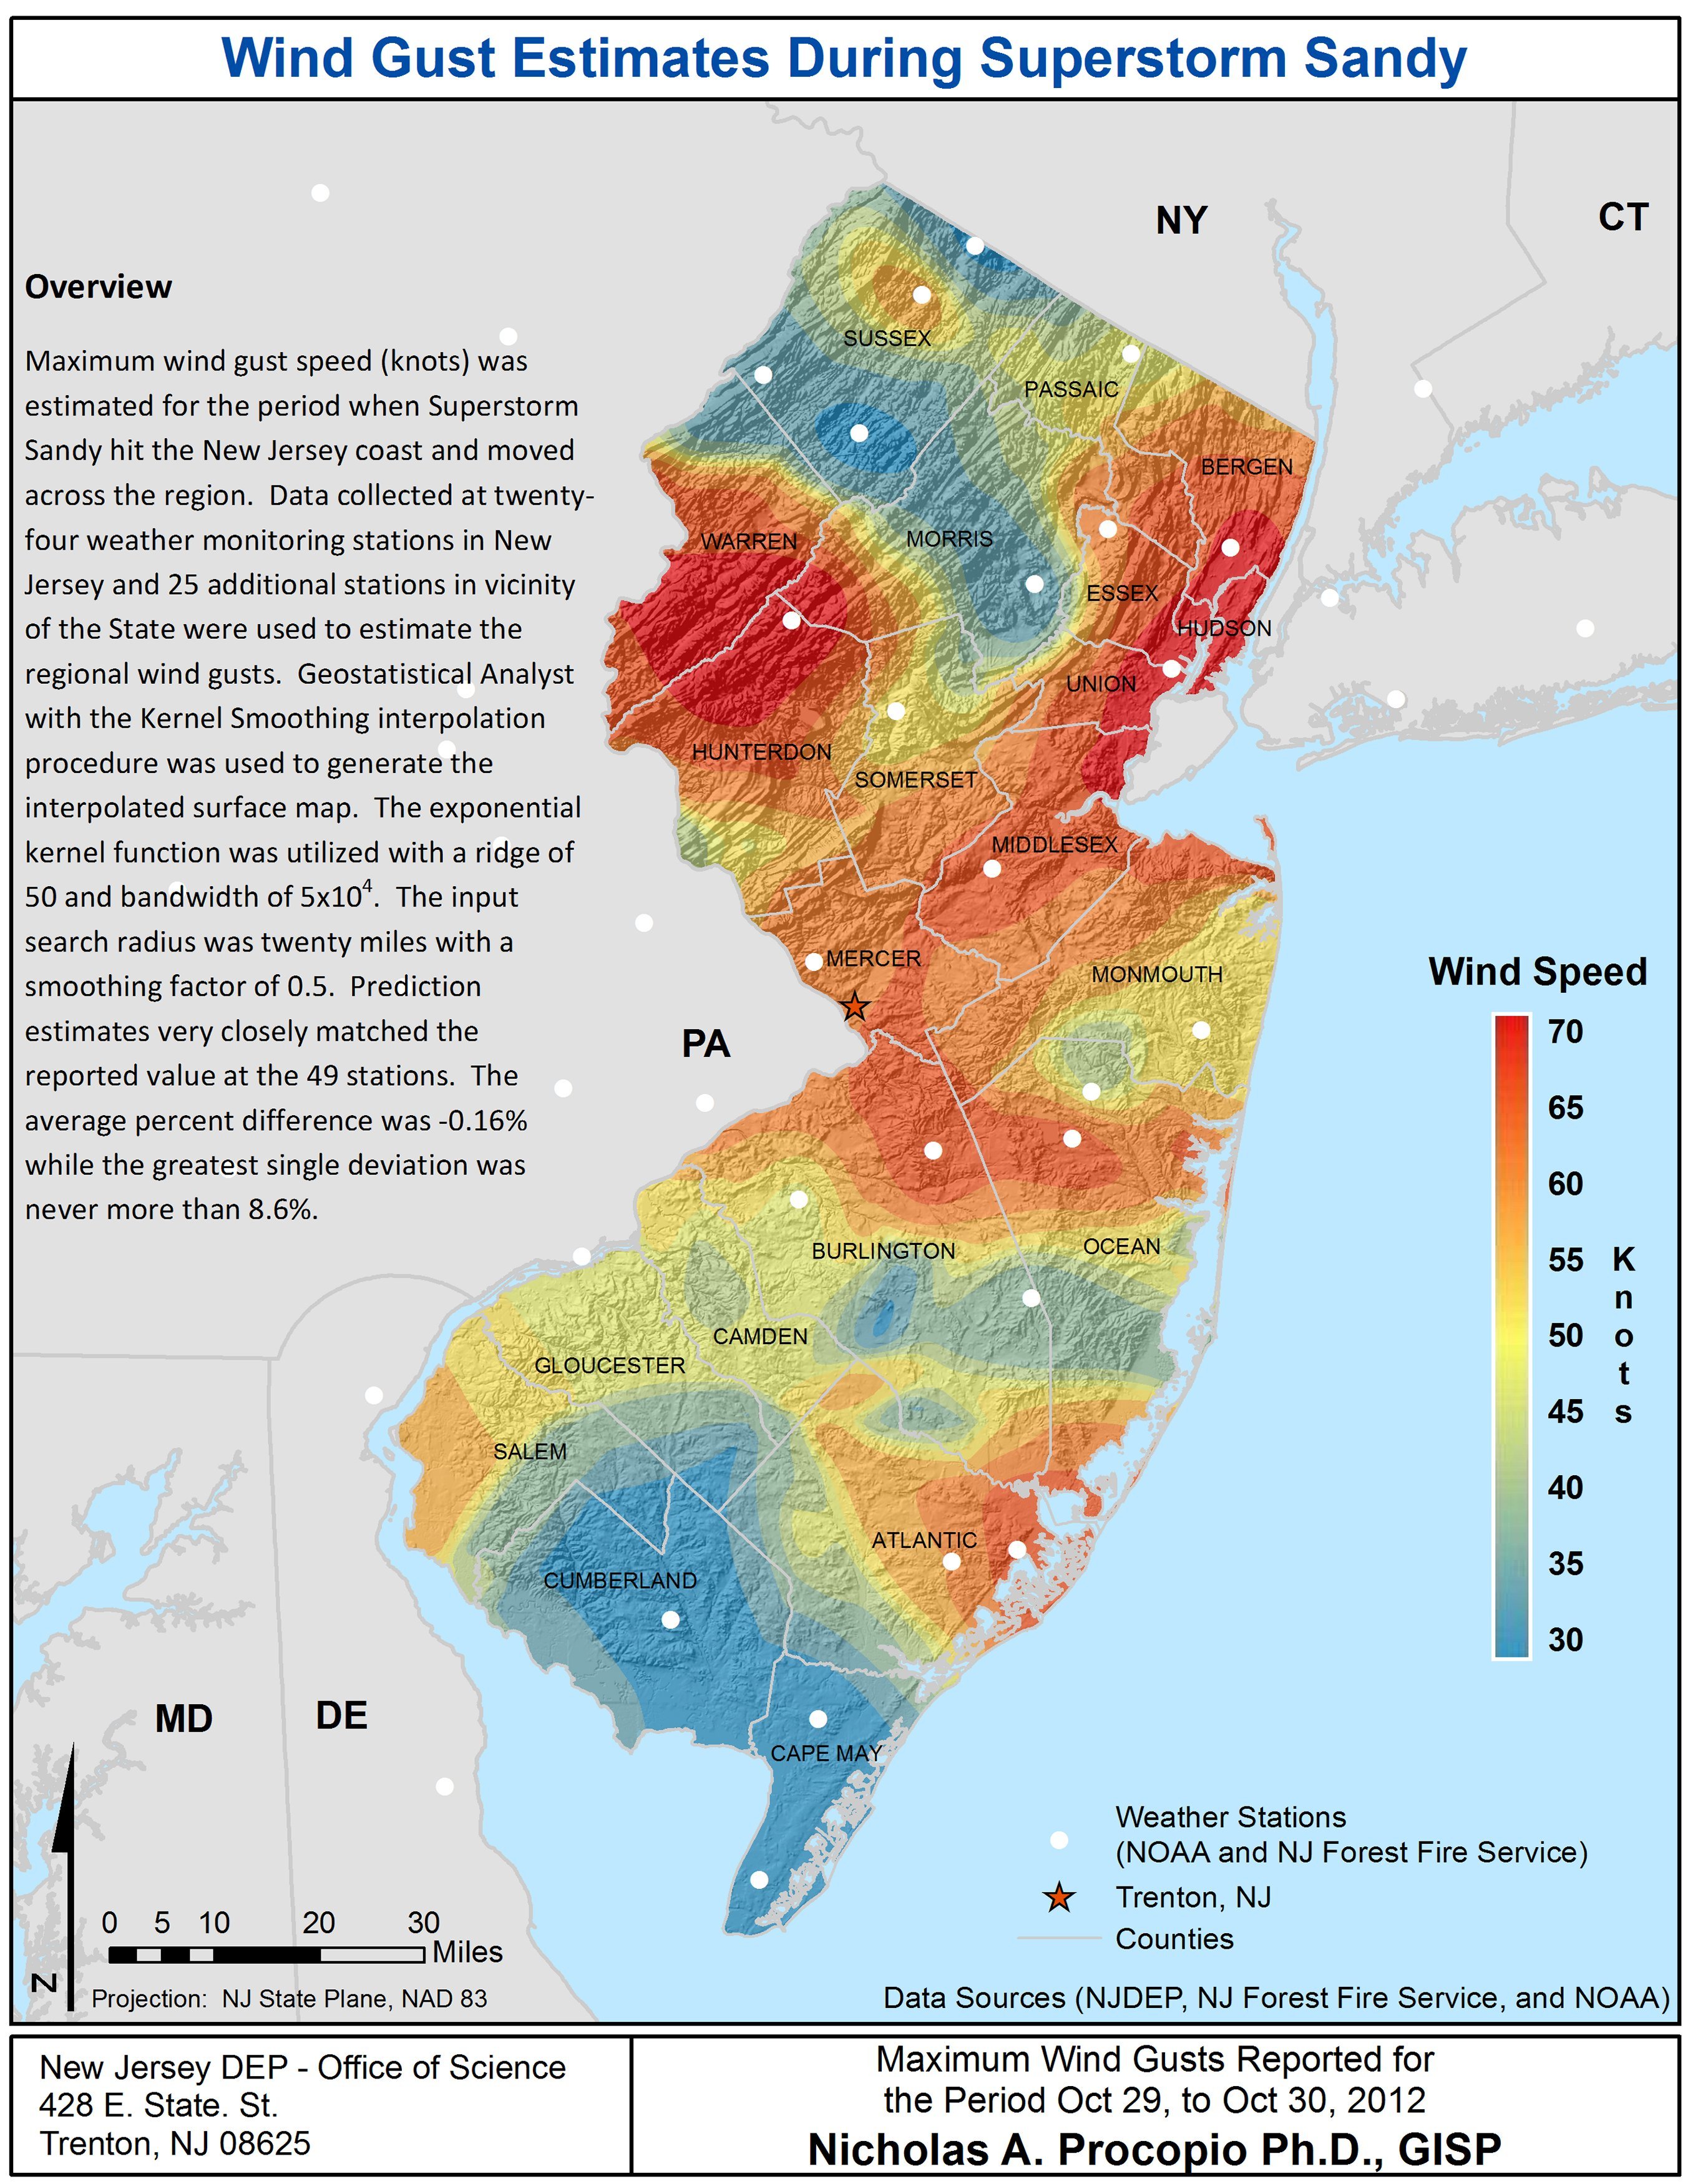
Wind Gust Estimates During Superstorm Sandy |
|
Name(s) of Author(s): |
Nick Procopio |
|
Organization: |
NJDEP Office of Science |
|
Email Address: |
nick.procopio@dep.state.nj.us |
|
Software Used to Make Map: |
ArcGIS |
|
Data Sources: |
NJDEP, NJ Forest Fire Service |
|
Map Description: |
Maximum wind gust speed (knots) was estimated for the period when Superstorm Sandy hit the New Jersey coast and moved across the region. Data collected at twenty-four weather monitoring stations in New Jersey and twenty-five additional stations in vicinity of the State were used to estimate the regional wind gusts. Geostatistical Analyst with the Kernel Smoothing interpolation procedure was used to generate the interpolated surface map. The exponential kernel function was utilized with a ridge of 50 and bandwidth of 5x10⁴. The input search radius was twenty miles with a smoothing factor of 0.5. Prediction estimates very closely matched the reported value at the 49 stations. The average percent difference was -0.16% while the greatest single deviation was never more than 8.6%. The model had a root-mean-square error (RMS) of 11.5. |