Using i-MapNJ to Identify Sensitive Populations and Resources
Alternate Format: Adobe Acrobat version [pdf 58 Kb]
To find a specific location:
- On the Internet, go to https://www.nj.gov/dep/ and disable any pop-up blockers on the computer.
- Scroll down and click on the i-MapNJ link on the left-hand side of the screen.
- This brings you to the Geographic Information Systems Interactive Mapping page. Under the “Available Applications” column, click on the i-MapNJ DEP image.
- A new web page will open, entitled “i-MapNJ DEP.” On the left-hand side of the screen, click on the yellow bar that says “Launch i-MapNJ DEP.”
- A new window will open. On the right side, under the section labeled “Query,” click on “Find location of Interest.”
- A small pop up window will open. Choose a Search Type to find your location of interest. Click find.
- A new window may appear, entitled “Address Match Candidates.” Click on the appropriate listing. A gold star may appear to identify your site.
To draw a radius:
- In the “Data Layers” column located on the left side of the screen, click on the visible box to show all the data layers of interest. When finished, at the top of the “Data Layers” column, select “refresh map”.
- Click on the “measure” tool located at the top of the screen. A box on the top of the map should appear. Distance measurements are shown in the “Segment” box.
- Click once on your site (there may be a gold star next to the address).
- Move your mouse away from the site. Using the Segment box, estimate 200 ft. and then click once. A radius segment should have appeared.
Residences:
- Once you have identified your location of interest and drawn a 200 ft. radius, you may use the “Aerial Photos 2002” data layer to identify if there are any residences within 200 ft. of the site boundary.
- In the “Data Layers” box on the left hand side of the screen, allow the “Aerial Photos 2002” data layer to be visible.
Potable wells:
- Once you have identified your location of interest and drawn a 200 ft. radius, you may use the “Public Community Supply Wells” data layer to identify if there are any wells in designated area that supply potable water to public communities.
- In the “Data Layers” box on the left hand side of the screen, allow the “Public Community Supply Wells” data layer to be visible and active.
- To identify a find a blue star indicating the presence of a Public Community Supply Well, click on the “Identify” button on the top of the screen. Then click on the blue star. A new window should appear with information regarding the well.
Child Care Centers and Schools:
- Once you have identified your location of interest and drawn a 200 ft. radius, ensure that the “Known Contaminated Sites List” and “NJEMs Sites” data layers are selected as visible. (On i-MapNJ, child care centers and schools are categorized as NJEMs or known contaminated sites, with Site Remediation Program interest.)
- To identify sites in a 200 ft. radius, in the “Data Layers” box, ensure that the correct data layer is selected as active. (If you see a red stars indicating that there is a Known Contaminated Site, allow the “Known Contaminated Site List” data layer to be listed as active. Similarly, if you see teal triangles in the 200 ft. buffer, allow the “NJEMs Sites” data layer to be active.)
- Click on the “select” button located at the top of the screen.
- Draw a box that encompasses the desired radius by clicking and holding down the left mouse button. When you are finished drawing the box, release the mouse button.
- A new window will open that contains all the NJEMS sites. Look for child care centers and schools, under the “Site Name” column.
- You may have to repeat this step if you find more than one type of site within a 200 ft. radius. For example, if you see red stars and teal triangles, this indicates both Known Contaminated Site(s) and NJEMs site(s) are located in the 200 ft. buffer. You will need to use the select tool twice; once with the NJEMs data layer active and once with the Known Contaminated Sites List data layer active.
- You may also identify one site at a time, so long as the correct data layer is selected. Simply select the “Identify” button on the top of the screen and then click on the symbol you would like to identify.
- Please note: NJEMS Sites are points representing sites regulated by NJDEP under one or more regulatory permitting or enforcement programs, or sites that are otherwise of some interest to a NJDEP program. Program interests included in NJEMS are: Air, Communications Center, Discharge Prevention, Exams and Licensing, Fish Game and Wildlife, Green Acres, Hazardous Waste, Lab Certification, Land Use, Landscape Irrigation, Parks and Forestry, Pesticides, Pinelands, Planning, Radiation, Right-to-Know, Site Remediation (Schools/Child Care Centers), Soil Conservation, Solid Waste, TCPA, Water Quality, Water Supply, and Watershed Management.
Parks and Playgrounds
- Once you have identified your location of interest and drawn a 200 ft. radius, you may use the “Aerial Photos 2002” data layer to identify if there are any open spaces, which may be parks and playgrounds, within 200 ft. of the site boundary.
- You may also use the “Open Space (State)” data layer to show areas owned by the state including state parks, state forests, wildlife management areas, natural areas, and recreation areas.
- Click on the visible and active boxes next to the “Open Space (State)” data layer.
- To identify any open space indicated by the blue shaded area, click on the identify button on the top of the screen.
- Then click on the blue shaded area and a new window should appear with information about the open space.
Surface Water
- Once you have identified your location of interest and drawn a 200 ft. radius, you may use the “Streams” and “Water bodies” data layers to identify lakes, ponds, bays and major watercourses, and more within the state. Allow the “Streams” and “Water bodies” data layers to be visible.
- To identify a streams or bodies of water, click on the select button on the top of the screen, and ensure the appropriate data layer is selected as active.
- Draw a box that encompasses the desired radius by clicking and holding down the left mouse button. When you are finished drawing the box, release the mouse button.
- A new window will open that contains information regarding the data layer selected as active.
- You may need to do this twice with different data layers active, in the event both streams and bodies of water are present.
Tier 1 well-head Protection areas
- Once you have identified your location of interest and drawn a 200 ft. radius, ensure that the “Well head Protection Areas (Community)” and “Well Head Protection Areas (Non-Community)” data layers are visible.
- To identify any well head protection areas as indicated by large colored circles, click on the blue identify button on the top of the screen. Ensure that the appropriate data layer is selected as active. Then click on one of the colored circles. A new window should appear with information about the area.
- You may need to do this twice with different data layers active, in the event both community and non community well head protection areas are present.
To Print
- You may choose to print the sites identified/selected using Microsoft® Excel. Right click and choose “Select All.” Right click again and choose “Copy.” Open Microsoft Excel and right click and select paste into a new sheet.
- To print the map, hit the “Print” button located at the top of the screen.
- This will open a new window where you can customize the title name. Click “Create Print Page” when finished.
|
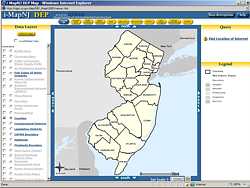
i-MapNJ DEP Main Screen
i-MapNJ DEP Disclaimer
The information contained in this site is the best available according to the procedures and standards of each of the contributing programs. The Department's programs are regularly maintaining the information in their databases and GIS layers, in order to maintain the quality and timeliness of the data. However, unintentional inaccuracies may occur. The Department has made every effort to present the information in a clear and understandable way for a variety of users. However, we cannot be responsible for the misuse or misinterpretation of the information presented by this system. Therefore, under no circumstances shall the State of New Jersey be liable for any actions taken or omissions made from reliance on any information contained herein from whatever source nor shall the State be liable for any other consequences from any such reliance. |