New Jersey's surface waters provide much of the water used for drinking water supplies, recreation, fishing, boating, swimming, commercial fisheries including shellfish, and tourism, all of which support our State's' ecology, economy, and quality of life for our residents.
The New Jersey Integrated Water Quality Assessment Report (Integrated Report) is a compilation of information about the quality of New Jersey's surface waters. The New Jersey Department of Environmental Protection (DEP) prepares the Integrated Report as a biennial assessment of statewide water quality that identifies and prioritizes waters for protection, restoration, and additional monitoring or research. The Integrated Report thus serves as an effective tool for enhancing, maintaining, and restoring water quality in all surface waters of the State to support their use for aquatic life, recreation, water supply, fish consumption, and shellfish harvest for consumption.
The primary purpose of the water quality assessment program is to determine the health of New Jersey's water resources so the appropriate steps can be taken to restore, maintain and protect our water resources and their designated uses. Water quality standards, monitoring, and assessment provide the scientific foundation for the integrated assessment that supports protection of New Jersey's water resources and implementation of the federal Clean Water Act, the New Jersey Water Quality Planning Act, and the New Jersey Water Pollution Control Act.
The DEP initiates a new water quality assessment cycle every two years. All existing and readily available data is evaluated to ensure that it meets established data quality requirements. The Integrated Water Quality Assessment Methods (Methods Document) describes the guidelines, protocols, and procedures how the data is used to determine water quality conditions.
The Methods Document provides an objective and scientifically sound assessment methodology, including:
An explanation of DEP's SWQS criteria and policies;
A description of the data and the quality assurance process to determine the use of any existing and readily available data;
A description of the methods used to analyze water quality and biological data to determine designated uses support;
A description of the guidance and policy for the Integrated Report.
Assessment units (AUs) represent the scale at which waters of the State are grouped for assessment purposes. New Jersey waters are grouped into 958 AUs, which are delineated based on the U.S. Geological Survey (USGS) 14-digit Hydrologic Unit Code (HUC) boundaries except for waters of the Barnegat Bay Estuary and the Delaware River, and are grouped within five water regions.
A different water region is selected each assessment cycle, on a rotating basis. Since 2014, New Jersey has employed a rotating regional approach to integrated water quality assessments. Under this approach, the Department completes a comprehensive, detailed analysis of water quality in one of New Jersey's five water regions, Atlantic Coastal, Raritan, Lower Delaware, Upper Delaware and Northeast each assessment cycle.
This rotating regional approach produces a comprehensive assessment of the entire State every ten years and supports development of measures to restore, maintain, and enhance water quality tailored to the unique circumstances of each regions.
New Jersey is the fifth smallest, but most densely populated state in the Nation. NJ is also one of the most geologically and hydrogeologically diverse states.
New Jersey has a variety of surface waterbody types that range from intermittent streams to large river systems (a significant number of which are tidally influenced); acres of lakes, ponds, and reservoirs; and miles of estuarine and coastal (ocean) waters. Wetlands are found near most surface waterbodies, both freshwater and saltwater.
New Jersey's surface water systems are located in a wide variety of geologic settings, from the past glaciated regions of northern New Jersey to the coastal plain of southern New Jersey, and include ecologically unique and/or protected areas such as the Pinelands and the Highlands regions.
RESOURCES
EXTENT
State Population (2019) 1
8,882,190
State Total Area (square miles)
8,772
State Total Land Area (square miles)
7,254
Rivers and Streams:
Miles of Nontidal Rivers and Streams
Miles of Tidal Rivers and Streams
Miles of Rivers and Streams (total)
Border Miles Shared Rivers
13,695
5,730
19,425
197
Lakes, Ponds and Reservoirs:
Total Acres of Lakes and Ponds and Reservoirs
Number of Reservoirs
Acres of Reservoirs
47,620
43
14,970
Estuaries and Ocean:
Square Miles of Estuaries
Miles of Ocean Coast (linear miles)
Square Miles of Ocean (jurisdictional waters)
650
127
470
Wetlands:
Acres of Freshwater Wetlands
Acres of Tidal Wetlands
Total Acres of Wetlands
739,160
209,269
948,429
1) 2019 US Census estimate
Spatial extents shown in this table are calculated based on 1:24,000 scale from the Department's GIS coverages for the applicable water resource including the National Hydrography Dataset (NHD), surface water quality classification, lakes, coastal waters, and wetlands (2002).
Data Organizations contributing to the Integrated Report
The DEP employs an integrated approach to assessing water quality by compiling a vast amount of water monitoring data and related information collected by numerous sources throughout the state.
While the principal contributor of water quality data used for assessment purposes is generated by the DEP, numerous monitoring organizations and other partners also collect relevant data. These include federal and county government agencies, regional commissions (e.g., Pinelands Commission) watershed associations and other voluntary citizen monitoring, and utility organizations.
All monitoring data must have an approved Quality Assurance Project Plan (QAPP) that includes acceptable sampling procedures. Information for developing QAPPs, sampling protocols and other resources for water monitoring may be found on the DEPs website.
DEPs strategic goal outlined in the "New Jersey Water Monitoring & Assessment Strategy (2005-2014)" to develop a comprehensive monitoring program for all waters of the state has resulted in a drastic increase in the number of monitoring stations and samples collected over the last decade. In collaboration with other water monitoring stakeholders and agencies, the number of AUs with data has risen significantly and has resulted in a comprehensive understanding of water quality conditions.
Since 2006 which is the first Integrated Report that AUs were based on HUC14 sub-watersheds, the number of unassessed designated uses caused by insufficient data declined from 38% to only 18% AUs with insufficient data, the number of AUs with at least one designated use assessed rose to 97% statewide, and the number of AUs where all of the designated uses are assessed rose over 35% to 62% statewide 1.
1. This includes all of the designated uses except for fish consumption.
Primary water quality data portal. All data collected by the DEP and other monitoring organizations is accessed through the WQP. Does not include continuous data.
Find current beach status, water quality sample results, reports of beach advisories and beach closings, and information on other events that affect beaches.
Find current shellfish harvesting classification including data from monitoring stations.
Water quality assessments are categorized into three statuses, Fully Supporting, Not Supporting, or Insufficient Data for assessment. Based on EPA guidance, these statuses are placed in sublists for the Integrated Report as described in the table below. In addition, subparts are added to Sublist 4 and Sublist 5 to help clarify the response strategy for impairments.
Sublist 1 / Sublist 2
An assessment unit is Fully Supporting designated uses and no uses are threatened.
Sublist 3
Insufficient Data and information to determine if the designated use is fully supported or not supported.
Sublist 4
One or more designated uses are Not Supported or are threatened but TMDL development is not required because of one of the following reasons:
Sublist 4A
A TMDL has been completed for the parameter causing designated use non-support.
Sublist 4B
Other enforceable pollutant control measures are reasonably expected to result in fully supporting the designated use in the near future.
Sublist 4C
Non-support of the designated use is caused by something other than a pollutant.
Sublist 5 (303(d))
One or more designated uses are Not Supported or are threatened by a pollutant(s), that requires development of a TMDL.
Sublist 5A
Arsenic does not attain standards, but concentrations are below those demonstrated to be from naturally occurring conditions.
Sublist 5L
Designated use impairment is caused by a "legacy pollutant" that is no longer actively manufactured or discharged by a point source.
Sublist 5R
Water quality impairment is not effectively addressed by a TMDL, such as nonpoint source pollution that will be controlled under an approved watershed restoration plan or 319(h) Watershed Based Plan.
Sublist 5 - Pollutants placed on the 303(d) List, also identify their priority ranking for TMDL development (High, Medium, Low). TMDLs for pollutants identified on Sublists 5A, 5L and 5R are assigned a low priority for TMDL development since alternative restoration measures are being pursued.
Sublist 5R - Development of a watershed restoration plan can be an effective alternative to a formal TMDL to characterize pollutant sources, the reductions needed to attain standards, and the means to achieve the reductions. The DEP is pursuing this approach where stormwater and nonpoint sources of pollution are considered to be the predominant source of water quality impairment.
Go to the link below to view the water quality assessment results as an interactive map. There are interactive maps for each designated use that present the designated use results along with each associated parameter result at the AU level and the stations within the AUs. Search for results by your current location, address, municipality, or AU name.
The Surface Water Quality Standards (SWQS), N.J.A.C. 7:9B, establish the designated uses and antidegradation categories of the State's surface waters, classify surface waters based on those uses (i.e., stream classifications), and specify the water quality criteria and other policies and provisions necessary to attain those designated uses. Designated uses include water supply for drinking, agriculture and industrial uses, fish consumption, shellfish resources, propagation of fish and wildlife, and recreation. In addition, the SWQS specify general, technical, and interstate policies, and policies pertaining to the establishment of water quality-based effluent limitations.
The current SWQS rules (N.J.A.C. 7:9B) were readopted in 2016 and amednded in 2020. The SWQS are used to develop regulatory requirements for other Department programs that will serve to protect the existing and designated uses of the State's surface waters. These programs include the New Jersey Pollutant Discharge Elimination System (NJPDES) program, Site Remediation Program, and various programs implemented by the Division of Land Use Regulation.
The SWQS also form the basis for the Integrated Report. Waters that exceed SWQS require the development of total maximum daily loads (TMDLs) or other alternative approaches to address the impairment. The Department has developed a Nutrient Criteria Enhancement Plan (NCEP) to explain the Department's approach to developing and enhancing the existing SWQS nutrient criteria and policies to protect designated uses of all New Jersey's surface waters, including saline waters (estuarine and marine).
The antidegradation policies instituted by SWQS are divided into three tiers: Outstanding National Resource Waters (ONRW), Category 1 Waters (C1), and Category 2 Waters (C2). ONRW carries the highest protection and applies to FW1 (nondegradation) and PL (Pinelands) waters. ONRW waters must be maintained in their natural state. The only changes to water quality allowed are those that restore natural water quality. C1 waters are recognized due to their exceptional ecological, recreational, water supply, or fisheries significance. C2 waters protect designated uses and require improvements to waterbodies that do not meet standards. In all three tiers, designated uses and water quality must be maintained and protected, and impairments must be restored to standards.
Safe, clean water is vital to New Jerseys health, quality of life and economy.
The DEP determines water quality in the State by verifying if waterbodies are supporting their designated uses. This is achieved by evaluating the water quality parameters associated with each designated use and whether they meet their surface water quality standards (SWQS). The SWQS identify specific designated uses for the waters of the State according to their waterbody classifications. Designated uses include:
The waters of New Jersey are exceptionally stressed. As the most densely populated state in the country, numerous pollutants from point and nonpoint sources are impacting water quality. Decades of industrial growth and urbanization, loss of important wetlands, fragmentation of forested areas, direct discharges to waterbodies, aging infrastructure, increases in storm runoff, damming of rivers and streams, climate change and numerous other anthropogenic activities have caused water quality degradation throughout the state. Additionally, historical practices before environmental regulations such as untreated discharges, indiscriminate dumping and abandonment of industrial sites have left behind a legacy of contaminated sites that still impact our waterbodies.
In response to these stressors to water quality, the DEP for over 50 years has implemented numerous programs to protect, maintain and restore waters of the State. These programs implement regulatory and non-regulatory actions that are described in more detail under the Restoration and Protection Efforts and Water Pollution Control Programs tabs in this report.
The designated use results reflect an increase in the number of impaired waters in New Jersey compared to previous reporting cycles. However, this does not necessarily indicate worsening water quality conditions. In each listing cycle, there are changes that affect the assessment universe and protocols for assessment decisions.
Improved detection limits for measuring pollutants,
Improved sampling techniques,
Improved equipment technology,
More rigorous assessment procedures, water quality standards, and waterbody classifications
Most importantly, sampling in waters that were previously unassessed has resulted in an increase in the number of impaired waters.
Go to the link below to view the results as an interactive map. There are interactive maps for each designated use that present the designated use results along with each associated parameter result at the AU level and the stations within the AUs. Search for your results by your current location, address, municipality, or AU name.
Changes to Designated Uses Statewide from 2016 to 2020
New water quality monitoring notably reduced the number of AUs with insufficient data with the predominance of the changes occurring in the focus regions of Lower and Upper Delaware. The majority of the new changes to designated uses confirmed impaired conditions. Trout aquatic life use was the only designated use that showed improvements.
Water supply use revealed a significant shift from fully supporting to impaired conditions as a direct result of more intense arsenic sampling. Arsenic is the predominant cause of water supply use impairment with 96% of the impaired AUs affected by arsenic. The frequency of arsenic impairment has increased over time due to improved laboratory detection of arsenic at levels approaching the SWQS human health criterion for arsenic of 0.017 micrograms per liter (ug/L) and a drastic increase in sampling. The human health criterion is much more stringent (by more than an order of magnitude) than the New Jersey maximum contaminant level (MCL) of 5 ug/L established in the Safe Drinking Water Act rules at N.J.A.C. 7:10-5.2.
What is the difference between the MCL and SWQS? Although the same health risk factors are used to develop the MCL and SWQS human health criteria, the Safe Drinking Water Act takes into consideration additional factors such as the feasibility of treatment, cost, and analytical capabilities to set the MCLs for all treatment facilities. Surface water quality criteria are based solely on data and scientific research on pollutants and their environmental and human health effects, SWQS do not consider economic or social impacts. The SWQS criteria is based on a risk level of one-in-one-million and expressed as a 70-year exposure average.
As a result, 431 AUs are not supporting based on the SWQS human health criteria, but only a few waterbodies have any incidences of arsenic concentrations above the drinking water MCL.
Fish Tissue Mercury, PCB, Chlordane, Dioxin, Dieldrin, DDT and metabolites, Heptachlor, Hexachlorobenzene, Endosulfan
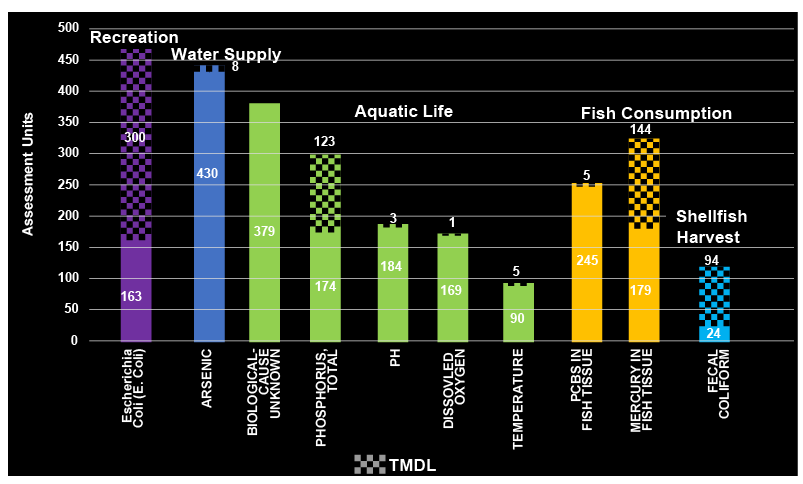
2020 Top Ten Causes of Use Impairment
It is critical to identify the drivers of impairment in order to develop management actions to address the issues in the States waters.
One of the management actions the DEP use to help restore water quality is the total maximum daily load (TMDL). TMDLs diagnose the source of the problem and quantify the water quality recovery.
A TMDL implementation plan is developed to identify a suite of measures that are needed to reduce loads from each pollutant source to levels that will meet surface water quality standards. The measures include both regulatory and non-regulatory actions.
Regulatory measures typically include effluent limitations or additional measures that are incorporated into wastewater or stormwater permits issued pursuant to the New Jersey Pollutant Discharge Elimination System (NJPDES). br
Non-regulatory measures include best practices for agricultural land use, riparian restoration, and promoting watershed stewardship activities such as rain gardens and rain barrels. These can often be accomplished through receipt of grants related to nonpoint source pollution.
E. coli is the most frequent cause of water quality impairment statewide and is associated with primary recreation use. In many areas, pathogen levels increase dramatically during rainfall events, indicating stormwater runoff (nonpoint sources of pollution) as the source. These sources may be from human, pet, livestock, or wildlife waste. Common causes of high e. coli levels include stormwater runoff, septic system failures, illicit sewer system connections, livestock, manure storage facilities, agricultural lands that receive manure applications, wildlife including geese, and resuspension from sediments. Most of these impairments (65%) are already covered by an approved TMDL.
Arsenic is the predominant cause of water supply use impairments with 96% of the impaired AUs impacted by arsenic. The frequency of arsenic impairment has increased over time due to improved laboratory detection of arsenic at levels approaching the SWQS human health criterion for arsenic of 0.017 micrograms per liter (ug/L). The contamination of a drinking water source by arsenic can result from either natural or human activities. Arsenic is an element that occurs naturally in rocks and soil, water, air, plants, and animals. Although about 90 percent of the arsenic used by industry in the United States is currently used for wood preservative purposes, arsenic is also used in paints, drugs, dyes, soaps, metals and semi-conductors. Agricultural applications, mining, and smelting also contribute to arsenic releases.
Degraded biological communities have been identified as the most frequent reason for aquatic life use impairments. This indicator directly confirms the conditions for aquatic life, although causes are unknown for the biological degradations. Total phosphorus has been identified as the most frequent chemical parameter causing aquatic life impairments and has been a focus for TMDL development, with 123 TMDLs completed by the DEP to date. Dissolved oxygen and pH-caused impairments are often associated with nutrient over-enrichment that will respond to restoration efforts aimed at controlling nutrients. Nutrient enrichment from point sources (e.g., sewage treatment plants), land use practices (e.g., application of fertilizer), and land disturbance (e.g., loss of riparian buffers and increase in impervious surface), are common sources of these impairments.
High temperature levels are the predominant cause of trout aquatic life use impairments. Criteria for temperature are lower in trout waters than in other waters of the state because of the sensitivity of the target species. Agriculture, urban development, and damming of streams are the predominant cause of reducing tree canopy in a watershed and causes higher water temperatures. These disturbances also elevate nutrient levels and impact biological communities.
Bioaccumulative toxic pollutants are the major cause of restrictions on fish consumption use. PCBs and mercury are the most common bioaccumlative pollutants found in fish tissue. Although PCB is no longer manufactured, it is still used in some industries and it has longevity in the environment. The major source of impairment for mercury is atmospheric deposition from air sources located outside the state and is an issue in the entire Northeast United States.
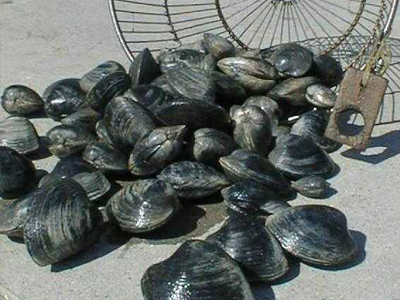
Bacterial contamination impacting the states freshwaters are also impacting shellfish harvesting areas. Fecal coliform is the indicator used to determine if bacterial levels are safe for shellfish harvesting. TMDLs have been developed for most of the AUs assessed as not supporting the shellfish harvest for consumption use (80%). These TMDL waterbodies are located exclusively in the bays and tidal rivers. Ocean waters are 100% fully supporting shellfish harvesting based on water quality data.
Go to the tables below to view all parameter results at the AU level and Station level.
Go to the link below to view the results as an interactive map. There are interactive maps for each designated use that present the designated use results along with each associated parameter result at the AU level and the stations within the AUs. Search for your results by your current location, address, municipality, or AU name.
Impaired waterbodies that have water quality parameters not attaining their criteria are listed on the 303(d) List and Sublist 4. The 303(d) List represents AUs that are not meeting their use caused by a pollutant that requires a TMDL. Sublist 4 are AUs that are not meeting their use caused by a pollutant which is addressed by a TMDL or other enforceable action that is expected to result in full support in the future. Biological impairments are a direct indicator of the health of a biological community although causes are unknown. The DEP is developing strategies to address these impairments. The complete 303(d) List and Sublist 4 for 2018 and 2020 can be downloaded by selecting the links below.
303(d) List and Sublist 4 table links
2020 303(d) and Sublist 4 Parameters
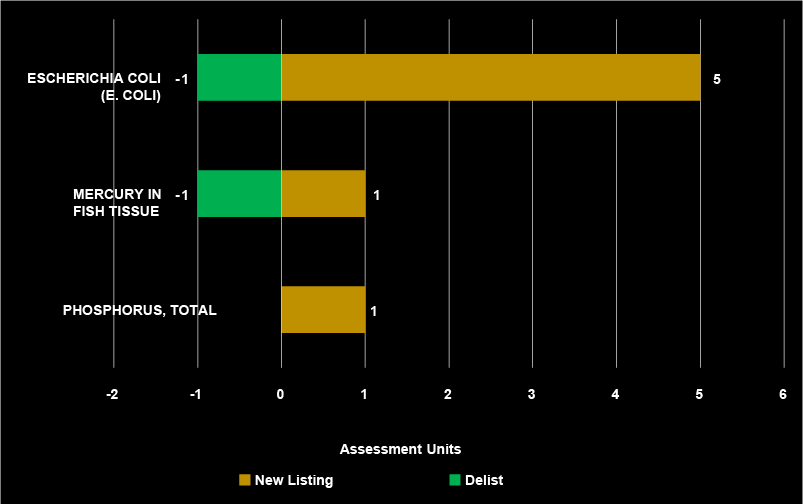
Parameter New Listings and Delistings 303(d) List
Every cycle there are changes to the Sublists including the 303(d) List and Sublist 4. All new listings are based on the latest data collected while delistings may be based on new data, TMDLs or other enforceable action moving a parameter from the 303(d) to Sublist 4, or original listing was not correct because of an error.
Parameter New Listings and Delistings 303(d) List from 2016 to 2020
Reason for Delisting from the 303(d) List
Parameter
New Data
TMDL
Original Listing Incorrect
SWQS Not Applicable
ALUMINUM
4
ARSENIC
2
BIOLOGICAL-CAUSE UNKNOWN
30
2
CHLORDANE IN FISH TISSUE
8
DDT IN FISH TISSUE
11
6
DIOXIN IN FISH TISSUE
1
DISSOLVED OXYGEN
4
5
ESCHERICHIA COLI (E. COLI)
4
HEXACHLOROBENZENE
1
MERCURY IN FISH TISSUE
10
11
5
MERCURY IN WATER COLUMN
1
PCBS IN FISH TISSUE
3
PH
3
PHOSPHORUS, TOTAL
4
TEMPERATURE
5
1
TOTAL SUSPENDED SOLIDS (TSS)
2
TURBIDITY
4
4
TOTAL
87
11
25
4
Parameter New Listings and Delistings Sublist 4
Parameter New Listings and Delistings 303(d) List from 2016 to 2020
Reason For Delisting From Sublist 4
New Data
Original Listing Incorrect
ESCHERICHIA COLI (E. COLI)
1
MERCURY IN FISH TISSUE
2
1
MERCURY IN WATER COLUMN
5
PHOSPHORUS, TOTAL
5
TOTAL
11
1
Much of the water quality data supporting the Integrated Report assessments are collected over a five-year to ten-year period, which provides a snapshot of conditions during that timeframe. Evaluating data over longer periods allows us to identify water quality trends and provides water quality changes over time to determine the effectiveness of water management programs in the State.
Recently, the USGS and the DEP completed new, robust statistical trend analysis demonstrating water quality trends in the state over a much longer time period than previous trend reports. Both reports cover at least a 30-year period with data from 28 physical/chemical monitoring sites distributed throughout the state. The latest report from NJDEP covers a 35-year period between 1981 to 2016 while the USGS report covers a 30-year period from 1981 to 2011.
New Jersey Water Quality Trends
Statewide
Total Phosphorus
▼
Total Nitrogen
▼
Nitrate
▲
Total Dissolved Solids and Chloride
▲
Metals and Ammonia
▼
Both long-term reports confirm decreasing concentrations for total phosphorus and total nitrogen trends; however nitrate, total dissolved solids, and chloride show increasing concentrations.
In the Lower Delaware and Upper Delaware Regions, similar trends were detected except for total nitrogen which showed mixed trend results.
In a separate analysis, statewide metal and ammonia impairments reveal a significant decrease from the 303(d) List since 1998. This does not include arsenic, which continues to be detected at low levels that exceed the human health criteria.
In the Lower Delaware and Upper Delaware Regions, 90% of the metal and ammonia impairments have been delisted from the 1998 303(d) List.
Why?
Since the 1980s, wastewater dischargers have been regionalized and upgraded to secondary treatment, New Jerseys Pollutant Discharge Elimination System (NJPDES) permits have reduced nutrient discharge concentrations, NJDEP nonpoint source pollution programs have been implemented, and local stewardship activities have targeted nonpoint source pollution which have all contributed to the reduction of total phosphorus and total nitrogen in our waterbodies.
Increases of nitrate in the State are attributed to ammonia reduction at wastewater treatment plants that oxidize ammonia to form nitrate, inadvertently results in increased nitrate concentrations. Ammonia is much more detrimental to the environment than nitrate because of its uptake of oxygen and its toxicity to aquatic life.
Runoff from urban and agricultural areas, including runoff of road salt used to control ice on roadways, is a major cause of increased TDS and chloride concentrations over time.
Metal and toxin improvements can be attributed to discharge limits for point source dischargers (both water and air), remediation of contaminated sites, and manufacturers closing or moving out of the state.
New Jersey Biological Trends
Statewide
Macroinvertebrate Communities
—
Fish Communities
—
New Jersey Biological Trends
Lower Delaware
Upper Delaware
Macroinvertebrate Communities
▼
▲
Fish Communities
▼
▲
▼ Downward Trend ▲ Uppward Trend — No Trend
The DEP employs very robust biological monitoring networks with the benthic macroinvertebrate monitoring network being the most comprehensive including over 760 stations sampled on a five-year cycle since 1989. In 2000, the DEP initiated a fish index network consisting of over 135 stations also sampled on a five-year cycle.
In 2017, DEP reviewed the biological data and updated its trends report on macroinvertebrate and fish communities. The report describes macroinvertebrate trends as moving away from excellent or poor ratings toward mostly good/fair conditions. For fish communities, conditions appear to be static with a slight negative trend.
Biological trends vary by region. Biological data collected in the Lower Delaware and Upper Delaware Regions show much different results than statewide trends. Macroinvertebrate and fish communities reveal improving conditions in the Upper Delaware while the Lower Delaware has declining conditions.
Ground Water Monitoring
As a companion to its surface water monitoring program, New Jersey has developed and now maintains a cooperative ambient ground water quality monitoring network with the United States Geological Survey (USGS), consisting of 150 wells screened at the water table. To date, five full sampling cycles have been completed (and will be referred to as sampling cycles 1 through 5 in this report). The primary goals of the New Jersey ambient ground water quality monitoring network (AGWQMN) are to characterize shallow ground water quality as a function of land use and to assess shallow ground water quality trends.
Network wells are screened or open just below the water table and therefore samples from them are generally expected to represent relatively young ground water. This is the ground water that interacts with and impacts surface water quality. The final distribution of wells as a function of land use is 60 in agricultural areas, 60 in urban/suburban areas, and 30 in undeveloped land use areas.
The state of New Jersey can be separated in 4 geologically unique regions or physiographic provinces each with unique rock types, landforms and hydrogeological settings. These geological variables affect natural ground water quality. For the purpose of this study, these physiographic provinces were separated into two study areas, coastal plain and bedrock (see map).
Ground Water Quality
Ground water is mainly recharged by precipitation that percolates downward through the unsaturated zone into the zone of saturation. Ground water quality is a reflection of: 1) the starting composition of precipitation; 2) the solubility and composition of the materials that the precipitation comes in contact with on the land surface, in the unsaturated zone, and in the saturated zone; and 3) the duration of that contact. Natural geologic materials impart a geochemical character to the water contacting it that is unique to those materials. Anthropogenic contaminants or pollutants in the form of dissolved gases, chemical constituents and possibly colloids and other particles can impact ground-water quality.
Data summaries of samples collected and analyzed from the 150 AGWQMN wells between 1999 and 2019 are presented and discussed. AGWQMN wells in undeveloped areas yield ground water with a more natural quality than those in agricultural and urban areas and therefore provide a reference for water quality that is little affected by human activity.
Water Quality
The water quality parameters or constituents such as temperature, dissolved oxygen, pH, and total dissolved solids (TDS) concentration values yield information about the general character of shallow ground water as a function of geology and land use. Lower pH and TDS values in the Coastal Plain reflect the difference in geologic makeup. In addition, it is generally cooler in northern New Jersey, which is reflected in the cooler shallow ground-water temperatures relative to the Coastal Plain shallow ground-water temperature in the southern portion of the State. The lower dissolved oxygen concentration in urban areas in both the bedrock and Coastal Plain may result from the large percentage of heat absorbing impervious surface area and resulting in poorer exchange with atmospheric oxygen, and the higher surface temperature affects the density of air. Increased total dissolved solids concentrations in agricultural and urban areas are due to the road salt and agrochemical applications. Many wells in agricultural land use areas are also near roads and therefore their water quality can also be impacted by road salt.
Trace Elements
Ground-water samples were analyzed for the following 15 trace elements (metals): aluminum, antimony, arsenic, barium, beryllium, boron, cadmium, chromium, copper, iron, lead, manganese, mercury, nickel, and selenium. Of these, eight trace elements (arsenic, beryllium, cadmium, iron, lead, manganese, nickel, and aluminum) have been detected at concentrations greater than the New Jersey Ground Water Quality Standards (GWQS) in all five sampling cycles except nickel not being detected above the GWQS in cycles 1 and 3.
Arsenic detection and concentrations in the bedrock regions are natural in origin with the number of detections that exceed the NJ Ground Water Quality Standard dropping between sampling cycles.
ron and manganese detections and concentrations have a strong urban association and possibly a weak agricultural association. The reducing conditions found in the agricultural and urban land use areas, indicated by the lower dissolved oxygen concentrations found in these land use areas, are conducive to iron and manganese mobility.
In the Coastal Plain of New Jersey (southern NJ), iron and aluminum are most likely natural in origin. As observed in the bedrock provinces monitoring wells, manganese has an urban and agricultural land use association. Acidic and reducing ground-water conditions in the Coastal Plain will mobilize the iron, aluminum, and manganese.
Mercury is detected at low levels, generally less than 1 µg/L. Fertilizers, agrochemicals, and lawn care products could be the source or mobilization agent for the beryllium, cadmium, lead, and nickel observed in the Coastal Plain.
Nutrients
Nutrient concentrations are dominated by nitrate, and the frequency and concentration by land use in both the bedrock provinces (northern NJ) and the Coastal Plain (southern NJ) are agricultural greater than urban, which is greater than undeveloped. The majority of concentrations of nitrite plus nitrate as milligrams per liter (mg/L) of nitrogen that exceed the GWQS of 10 mg/L were observed in the agricultural land use monitoring wells. The use of nitrogen-based fertilizers in agricultural and urban areas and possibly septic system and sewer system leakage are considered to be the major sources.
In the first four sampling sampling cycles, orthophosphate concentrations were all less than 1.0 mg/L. In cycle 5, three monitoring wells had concentrations greater than 1.0 mg/L with a maximum concentration of 2.58 mg/L as phosphorous. Two of these wells were in agricultural land use areas while the third classified as urban land use.
Volatile Organic Compounds and Pesticides
The ground-water samples were analyzed for 35 volatile organic compounds (VOCs). The frequency of VOC detection is a function of land use. Of the three land uses, the samples from the urban land use monitoring wells generally had the highest frequency of detection of VOCs. It should be noted that a high percentage of undeveloped wells in the Coastal Plain had detections for one compound, chloroform (trichloromethane). Aside from chloroform detections, the frequency of VOC detection in undeveloped land use areas is relatively low.
Methyl tertiary-butyl ether (MTBE), an additive in gasoline, showed a steep decline in the frequency of detection, especially in the bedrock provinces. There were no detections above the GWQS of 70 µg/L. The decrease in detections of MTBE can be attributed to a ban on using MTBE in the State of New Jersey.
The concentration and frequency of detections of pesticides Statewide is land use driven with agricultural land use the primary source. The number of compounds detected fluctuates over the five sampling cycles. There were detections of 33 of the 80 compounds in cycle 5. Atrazine and its degradation product 2-chloro-4-isopropylamino-6-amino-s-triazine (deethylatrazine), metolachlor, prometon, and simazine are herbicides used to control grasses and broadleaf plants are frequently detected compounds in all sampling cycles.
Radionuclides
Gross alpha particle activity was analyzed. Generally, higher radium activity is found in the Coastal Plain versus the bedrock provinces in all land use. This is most likely due to the greater abundance of radium-224 and the low pH of the ground water in the Coastal Plain. The low pH can increase radiums mobility. In both the combined bedrock and Coastal Plain provinces, and in both sampling cycles, the highest activity is associated with agricultural and urban land use areas. In the Coastal Plain, the frequency of gross alpha concentrations above the standard ranged between 11% and 20% over the five sampling cycles with a generally increasing trend. In the bedrock provinces, there was only one monitoring well sample that exceeded the standard in sampling.
Aquatic Life General
Aquatic Life Trout
Recreation Primary
Recreation Secondary
Water Supply
Shellfish
Fish Consumption
Designated Use Results for Lower and Upper Delaware Regions
Designated use results in the Upper and Lower Delaware Water Regions are similar to statewide conditions for aquatic life general, primary recreation, secondary recreation, and fish consumption. For aquatic life trout, trout waters predominately located in the Upper Delaware Water Region demonstrated slightly higher water quality than statewide. Increased sampling for arsenic has resulted in a high percentage of AUs not attaining water supply designated use throughout both water regions. Shellfish harvest for consumption had no fully supporting AUs in the Lower Delaware Water Region.
Aquatic Life General
Aquatic Life Trout
Water Supply
Recreational Primary
Recreational Secondary
Fish Consumption
Shellfish
State
DE
State
DE
State
DE
State
DE
State
DE
State
DE
State
DE
Full Support
19%
21%
18%
25%
30%
23%
24%
25%
47%
18%
1%
0%
20%
0%
Insufficient Data
13%
15%
25%
23%
15%
11%
25%
22%
53%
82%
64%
57%
13%
10%
Non Support
68%
64%
57%
52%
54%
66%
51%
53%
0%
0%
36%
43%
68%
90%
Although designated use results in the two Delaware Water Regions were similar, there were noticeable disparities for aquatic life and primary recreation. In the Upper Delaware Water Region, water quality conditions for general aquatic life general are significantly healthier than in the Lower Delaware Water Region with 39% fully supporting compared to only 10%, respectively. Additionally, the Upper Delaware Water Region (103) has a significant higher number of trout waters compared to the Lower Delaware (1). Trout waters are usually considered higher quality waters compared to non-trout waters in order to support these highly sensitive fish. There are many factors that can be attributed to the difference between the two regions. One of the most important factors is the variation in land use.
Land use within the Upper Delaware Water Region shows a high percent of undeveloped land such as wetlands and forests that comprise of 59% of the land cover while in the Lower Delaware Water Region only 46% of the land is undeveloped. Aquatic life conditions show significant differences between the Upper and Lower Delaware Water Regions due to intact riparian zones in the Upper Delaware Water Region and degraded riparian zones in the Lower Delaware Water Region. Aquatic life use changes also show the Upper Delaware Water Region with an increase in the number of AUs fully supporting this designated use while the Lower Delaware decreasing the number of AUs supporting.
Although the undeveloped land use associates with aquatic life use conditions, it contradicts the results for primary recreation in the Upper Delaware Water Region where bacterial levels exhibit more degraded conditions with only 20% fully supporting the designated use compared to the Lower Delaware Water Region's 28% fully supporting. It is expected that based on land use, the water region with a high percentage of undeveloped land with a low number of anthropogenic sources would display high water quality for primary recreation especially since nonpoint runoff is a major source for bacterial contamination. The contradiction in the Upper Delaware Water Region may be attributed to higher than usual percentage of livestock runoff from agricultural uses directly impacting the waterbodies, a higher than usual percentage of failing septic systems, or even a higher than usual percentage of wildlife, such as geese, contributing to the higher bacterial levels.
Go to the link below to view the results as an interactive map. There are interactive maps for each designated use that present the designated use results along with each associated parameter result at the AU level and the stations within the AUs. Search for results by your current location, address, municipality, or AU name.
Changes to Designated Use
Lower Delaware Designated Use Changes From 2016 to 2020
Upper Delaware Designated Use Changes From 2016 to 2020
Parameters Water Quality
Top 10 Pollutants in the Lower and Upper Delaware Regions
The Top 10 pollutants in the Lower and Upper Delaware Regions are similar to Statewide results. There are a few changes such as arsenic being the number one pollutant in the Delaware Regions, biological impairments being surpassed by total phosphorus as the top pollutant for aquatic life use, and PCBs being of most concern in fish tissue. Overall, the same pollutants are common in the two regions as found statewide. However as with designated uses, there are disparities between the two regions for certain parameters.
As explained under the Designated Use and Biological Trend Sections, biological communities in the Upper Delaware are significantly healthier than in the Lower Delaware. Where biological data was sufficient for an assessment, the Upper Delaware has only 33% with impaired biological communities not supporting aquatic life use compared to the Lower Delaware where 60% of impaired biological communities do not support aquatic life use.
Pollutants impacting aquatic life such as total phosphorus and dissolved oxygen also reflect higher impaired conditions in the Lower Delaware whereas temperature exceedances are more prevalent in the Upper Delaware. Where data was sufficient for an assessment, high total phosphorus levels exceed their criteria in 64% of Lower Delaware AUs, compared to only 24% in the Upper Delaware. Associated impacts from high nutrient levels such as low dissolved oxygen levels are reflected in the Lower Delaware where 21% of the AUs are impaired while only 8% are impaired in the Upper Delaware. Temperature has much higher exceedance rates in the Upper Delaware (21% impaired) compared to the Lower Delaware (3% impaired). These high temperature exceedances occur in trout waters in the Upper Delaware where more stringent criteria protect the sensitive trout communities. Since there is only one AU in the Lower Delaware supporting a trout population, very few exceedances in temperature are found.
The predominance of fish tissue sampling verify high levels of contaminants that restrict the consumption of fish. PCBs in the Delaware Estuary account for a high percentage of the fish advisories. Legacy impacts and the longevity of PCBs in the environment have contributed to the high number of impaired waters in the Lower Delaware Region. The number of AUs with mercury in fish tissue impairments are found higher in the Lower Delaware compared to the Upper Delaware, but this is a reflection of the higher number of fish tissue sampling sites in the Lower Delaware rather than a higher fish tissue contamination issue.
Results for the other top ten pollutants arsenic, pH, and e.coli are similar in both regions. The bacterial indicator, fecal coliform, for shellfish harvesting assessments only applies to the Lower Delaware Region.
Parameters on the 303(d) List and Sublist 4 by Region
Go to the link below to view the results as an interactive map. There are interactive maps for each designated use that present the designated use results along with each associated parameter result at the AU level and the stations within the AUs. Search for your results by your current location, address, municipality, or AU name.
Impaired waterbodies that have water quality parameters not attaining their criteria are listed on the 303(d) List and Sublist 4. The 303(d) List represents AUs that are not meeting their use caused by a pollutant that requires a TMDL. Sublist 4 are AUs that are not meeting their use caused by a pollutant which is addressed by a TMDL or other enforceable action that is expected to result in full support in the future. Biological impairments are a direct indicator of the health of a biological community although causes are unknown. The DEP is developing strategies to address these impairments.
303(d) and Sublist 4 Parameter Listings Lower Delaware
303(d) and Sublist 4 Parameter Listings Upper Delaware
Parameter New Listings and Delistings 303(d) List
Every cycle there are changes to the Sublists including the 303(d) List and Sublist 4. All new listings are based on the latest data collected, while delistings may be based on new data, TMDLs or other enforceable action moving a parameter from the 303(d) to Sublist 4, or original listing was not correct because of an administrative error.
Parameter New Listings and Delistings 303(d) List Lower Delaware
Parameter New Listings and Delistings 303(d) List Upper Delaware
Reason For Delisting from 303(d) List
Parameters
New Data
TMDL
Original Listing Incorrect
SWQS Not Applicable
ALUMINUM
4
ARSENIC
2
BIOLOGICAL-CAUSE UNKNOWN
22
1
DDT IN FISH TISSUE
2
DISSOLVED OXYGEN
3
ESCHERICHIA COLI (E. COLI)
4
HEXACHLOROBENZENE
MERCURY IN FISH TISSUE
3
10
5
MERCURY IN WATER COLUMN
1
PCBS IN WATER COLUMN
1
PH
2
PHOSPHORUS, TOTAL
3
TEMPERATURE
1
1
TOTAL SUSPENDED SOLIDS (TSS)
2
TURBIDITY
2
1
TOTAL
40
10
16
4
Parameter New Listings and Delistings Sublist 4
Parameter New Listings and Delistings Sublist 4 for Lower Delaware
Parameter New Listings and Delistings Sublist 4 for Upper Delaware
Reason For Delisting From Sublist 4
Row Lables
New Data
ESCHERICHIA COLI (E. COLI)
1
MERCURY IN FISH TISSUE
1
PHOSPHORUS, TOTAL
3
TOTAL
5
Chemical Trends
Lower Delaware
Total Nitrogen
Nitrate
Total Phosphorus
Maurice River at Norma
—
▲
▼
Cohansey River at Seeley
▲
▲
—
Doctors Creek at Allentown
▲
▼
▼
McDonalds Branch in Byrne State Forest
—
—
—
Raccoon Creek near Swedesboro
—
—
—
Salem River at Woodstown
—
—
—
Upper Delaware
Total Nitrogen
Nitrate
Total Phosphorus
Wallkill River near Sussex
▲
▲
▼
Cohansey River at Seeley
▼
▼
▼
Doctors Creek at Allentown
—
▲
—
Delaware River
Total Nitrogen
Nitrate
Total Phosphorus
Delaware River at Portland
▼
▼
▼
Delaware River at Lumberville
▼
—
▼
Delaware River at Trenton
▼
▲
▼
▼ Downward Trend ▲ Upward Trend — No Trend
Recently, the USGS and NJDEP completed new robust statistical trend analysis demonstrating water quality trends in the state over a much longer time period than previous trend reports. Both reports cover over a 30-year period with data from 28 physical/chemical monitoring sites distributed throughout the state. The latest report from NJDEP covers a 35-year period between 1981 to 2016.
Lower Delaware nutrient trends show overall improving or stable conditions for total nitrogen and total phosphorus. Nitrate shows variable results. Watersheds with predominant agricultural land use such as Cohansey River at Seely can expect to see higher levels of total nitrogen and nitrate.
Upper Delaware nutrient trends show improving or stable conditions for total phosphorus. Total nitrogen and nitrate show mixed results. The increasing nitrate concentrations are at stations located downstream from major wastewater treatment plants.
The Delaware River shows improving trends for all nutrients. Delaware River trend results are from the USGS Report.
Why?
Since the 1980s, wastewater dischargers have been regionalized and upgraded to secondary treatment, New Jerseys Pollution Discharge Elimination System (NJPDES) permits have reduced nutrient discharge concentrations, NJDEP nonpoint source pollution programs have been implemented, and local stewardship activities have been targeting nonpoint source pollution which have all contributed to the reduction of total phosphorus and total nitrogen in our waterbodies.
Increases of nitrate in the Upper Delaware Region are attributed to ammonia reduction measures implemented at wastewater treatment plants that oxidize ammonia to form nitrate, inadvertently resulting in increased nitrate concentrations. Ammonia is much more detrimental to the environment than nitrate because of its uptake of oxygen and its toxicity to aquatic life.
Changes in land use also plays a factor in the stabilization of nutrients in the Delaware Regions where urban development has occurred on agricultural lands thereby replacing nutrient runoff from agricultural practices to inputs from less intensive domestic activities such as fertilizing of lawns. In the Upper Delaware, this is prominent where urban development has mostly replaced agricultural areas rather than wetland and forested lands. In the Lower Delaware, land use changes have shown urban development replacing undeveloped wetlands, forested lands and agricultural areas more equally.
Metal Trends
The most significant development in the Delaware Water Regions is the dramatic decrease of metal and ammonia levels resulting in a 90% decrease in the number of impairments on the 303(d) List since 1998.
In 1998, there were 304 impaired listings for toxic substances. In 2020, only 31 toxic substances remain on the 303(d) List.
This remarkable improvement is the result of
Issuing discharge limits for point source dischargers (both water and air)
Remediation of contaminated sites
Manufacturers closing or moving out of the region
Arsenic was not incorporated into this trend assessment. The frequency of arsenic impairment has increased over time due to improved detection of arsenic.
Statewide metals and toxic substances discharging into waterbodies have drastically been reduced, however, legacy issues still impact some areas of the state where metals remain in the sediment. During storms and high flow, these sediments can become resuspended in the water column and elevated metal levels can be found exceeding their criteria.
Declines of ammonia levels are attributed to improved wastewater treatment processes that have resulted in reduced discharge levels.
Metal and Toxic Substances Delistings Lower and Upper Delaware Regions
Metals and Toxics
1998 303(d) Listings
2020 303(d) Listings
Aluminum
12
0
Beryllium
33
0
Cadmium
40
0
Chromium
35
0
Copper
33
5
Iron
23
0
Lead
59
12
Mercury
43
6
Nickel
1
0
Silver
2
0
Zinc
8
0
Ammonia
15
0
Tetrachloroethylene (PCE)
0
4
Trichloroethylene (TCE)
0
4
TOTAL
304
31
Biological Trends
Overall, both fish and macroinvertebrate trend assessments point to worsening conditions in the Lower Delaware Region. Macroinvertebrate communities show overall degraded conditions with a worsening trend, while fish communities show overall fair conditions with a worsening trend*.
Biological monitoring only occurred in the freshwater portions of the region. Currently, there are no biological indices for tidal, non-freshwater rivers and streams.
Vast areas of the region are predominantly urbanized or agricultural with degraded riparian zones that reflect impacted biological conditions. In many headwaters, especially in the Pinelands, biological conditions are healthy.
Overall, both fish and macroinvertebrate trend assessments point to improving conditions in the Upper Delaware Region. Macroinvertebrate communities show overall healthy conditions with an improving trend, while fish communities show overall good conditions with an improving trend*.
In the Upper Delaware Region, forested areas account for over 45% of the land use. Additionally, healthy riparian zones that mitigate the impacts from agricultural and urban areas has resulted in healthy biological communities throughout the region.
Lower Delaware Macroinvertebrate Trend
Upper Delaware Macroinvertebrate Trend
* Macroinvertebrate trends based on data from the DEPs Ambient Macroinvertebrate Network (AMNET)
Fish trends based on data from the DEPs Fish Index of Biotic Integrity Network (FIBI)
Healthy riparian zone
Highly degrated riparian zone
Why?
During the last few decades, urbanization in the regions has increased significantly. The changes in the Upper and Lower Delaware Regions have shown different impacts on undeveloped wetlands and forested areas though. In the Upper Delaware, it appears most of the urban development has occurred in former agricultural areas rather than wetlands and forested areas. Whereas in the Lower Delaware Region, urban development has replaced more wetlands and forested areas than agricultural areas. Additionally, overall land use in the Upper Delaware Region show significant less urban and agricultural lands (32%) compared to the non-tidal portion of the Lower Delaware Region (54%).
An analysis of biological trends based on land use shows that impervious surface is the most predictive and reliable indicator for biological integrity and agrees with numerous other studies that have been published. We looked at agricultural lands, urban development and impervious surface at the assessment unit level and in riparian zones, defined as 300-ft buffers around the streams.
Where impervious surface exceeds 10%, the aquatic ecosystem displays extensive degradation with 90% of the biological communities impaired. However, this occurred only where riparian zones exceeded 10% impervious surface and did not show a clear response at the assessment unit level. Riparian zones show they are very sensitive to disturbances and that impervious surface is a much better predictor than agricultural or urban development land use.
Development in the riparian zone degrades the benefits from a healthy ecosystem by intensifying storm water flow, destabilizes streambanks, increases levels of sedimentation and other nonpoint pollutants, rises water temperatures, damages stream habitat, reduces infiltration into the soil, as well as increases the frequency and intensity of flooding and low stream flows.
The Upper Delaware Region exhibits significantly healthier riparian zones than the Lower Delaware Region which is reflected in the disparate biological community conditions in the two regions.
The DEP over the last 50 years has been entrusted to protect and restore our precious resources by preventing pollution, cleaning up contamination, ensuring ample water supply and investing in strong infrastructure. Numerous programs within the DEP designed to protect, maintain, enhance, and restore water quality implement many regulatory and non-regulatory actions. These action include developing TMDLs, issuing permits to upgraded wastewater dischargers, regulating stormwater, implementing land use management programs, providing restoration grants, managing nonpoint agricultural runoff, granting financial assistance for infrastructure construction, acquiring land, educating the community, protecting wetlands, controlling air quality, and enforcing compliance of water regulations.
Learn more about water the DEP's pollution control programs under the Water Pollution Control Programs tab.
Learn more about a few highlighted programs below:
Total Maximum Daily Loads (TMDLs)
TMDLs are an important tool to begin to restore our impaired waterbodies. TMDLs diagnose the source of problems and quantify the necessary water quality recovery to assist the DEP in achieving its priorities of waters that are swimmable, fishable and safe for drinking. TMDLs take into consideration point and nonpoint sources of pollution, natural background water quality, surface water withdrawals, and other environmental factors through calculations or computer models to ensure the SWQS are met.
A TMDL implementation plan identifies the measures needed to reduce the pollutant loads from each pollutant source. Regulatory measures can be assigned to facilities and municipalities in the TMDL, including effluent limitations in permitted discharges. Non-regulatory measures include best management practices for agricultural land use and riparian restoration, as well as promotion of watershed/local stewardship activities such as construction of rain gardens and rain barrels.
Category 1 Waters
The SWQS establish antidegradation policies for all surface waters of the State. The antidegradation policies require that all existing and designated uses shall be maintained and protected for all surface waters of the State; impaired waters must be restored to meet SWQS; and existing water quality shall be maintained.
One of the protective waterbody classifications is Category One (C1) waters. Category One waters are high quality streams, lakes and rivers designated through rulemaking for protection from measurable changes in water quality because of their exceptional ecological significance, exceptional water supply significance, exceptional recreational significance, and exceptional fisheries significance to protect and maintain their water quality, aesthetic value, and ecological integrity.
Recently, the DEP adopted amendments to the SWQS, that upgraded the antidegradation designation of approximately 600 river miles to Category One (C1) on March 4, 2020. The continual process of identifying high quality waters to receive C1 designation ensures that these resources are available for future generations. To date, approximately 7,400 river miles have been classified as C1; around 38 % of NJ waters. An additional 15% are Outstanding National Resource Waters (FW1 and PL) which also have strong protections.
Nonpoint Source Pollution Management Program
Addressing nonpoint sources (NPS) is a critical piece in the restoration efforts in the State. The NPS Management Program combines regulatory controls, non-regulatory strategies, watershed-based plans, restoration actions, and targeted funding to address NPS pollution. Every five years the programs objectives and initiatives are updated in its Program Plan.
Many of the waters placed on the 303(d) List are impaired primarily by nonpoint sources of pollution and regulated stormwater sources. For these impairments, development of a watershed restoration plan or watershed based plan (WBP) can be an effective alternative to a formal TMDL to characterize pollutant sources, the reductions needed to attain standards, and the means to achieve the reductions. The DEP has approved over twenty 9-element WBPs located throughout the state including in the Musconetcong watershed (not seen on map). These watersheds receive priority for NPS funding from the Water Quality Restoration Grant Program.
Water quality restoration grants are awarded by the DEP to fund watershed restoration activities and initiatives around New Jersey that address nonpoint source pollution. Generally, grants are focused on restoration of water quality impaired predominantly by NPS pollution for waters located in a priority waterbody or region where the grant will help implement an approved TMDL or Watershed Based Plan (WBP). Information about current and previous funding priorities, grant awards, and successful grant projects is provided in the link below.
In 2019 and 2020, the Department funded the development of eleven watershed restoration plans that will satisfy USEPAs recommended nine elements of a watershed based plan. The WBP work includes:
Developing a Watershed Restoration Plan for the Southern Barnegat Bay Little Egg Harbor Tributaries
Watershed Restoration/Protection Plan for the Cedar Creek Watershed
Watershed Restoration/ Protection Plan for the Oyster Creek Watershed
Watershed Restoration/Protection Plan for the Toms River Watershed
Watershed Restoration and Protection Plan for Budd Lake
Creation of a Lake Protection and Watershed Management Plan for Lake Topanemus
Watershed Restoration and Protection Plan for the Spruce Run Watershed
Development of a Lake Protection and Watershed Management Plan for Twilight Lake in Ocean County
Swartswood Lakes Nonpoint Source Watershed Management Plan
Update and Expansion of the Musconetcong River Watershed Protection and Restoration Plan
Watershed Restoration and Protection Plans for Miry Run Watershed and Doctors Creek Watershed
For more information on the Departments TMDL priorities please see the link below.
NJ Vision Approach for Assessment, Restoration and Protection
In 2013, USEPA issued guidance on a new vision and national goals for meeting the goals of the CWA Section 303(d). The Vision Document provides alternative strategies to restore impaired waters under USEPAs emphasis on TMDLs as the sole means to attain designated uses and water quality standards. USEPAs vision provides additional flexibility under the 303(d) Program for states to identify and prioritize waterbodies for restoration and protection through whatever means are appropriate under existing programs regulatory frameworks, and achieve water quality objectives in accordance with the states priorities.
Beginning with the 2014 Integrated Report, the DEP published the New Jerseys Vision Approach for Assessment, Restoration and Protection of Water Resources under the Clean Water Act Section 303(d) Program explaining New Jerseys strategy for managing the CWA Section 303(d) Program in accordance with guidance issued by USEPA. The new vision includes 6 goals: Engagement, Integration, Protection, Prioritization, Alternatives, and Assessment.
New Jerseys Vision Approach is designed to accomplish both federal and State water quality goals through statewide ambient water quality monitoring, water quality standards that protect and support designated uses of New Jerseys waters; assessment of water quality to determine support of designated uses; development, implementation and funding of strategies to protect and restore water resources; and communication and partnership with the public.
Delisting From 303(d) and Sublist 4
The DEP documents improvements in water quality through the delisting of impaired waters from the 303(d) List and Sublist 4. Delisting may be based on new data, approved TMDLs, or corrections to previous listings. Water quality improvements are only valid where new data confirms full support. Click on the link to see all delisting from 2016 to 2020 based on new water quality data.
NPS Success Stories
Efforts through the NPS Pollution Management Program has achieved measurable improvements in water quality. NPS success stories highlight waterbodies identified as being primarily nonpoint source-impaired and having achieved documented water quality progress.
This isnt an all-inclusive list but spotlights several watersheds where strong partnerships in restoration efforts have resulted in improvements where previously impaired waters are now fully supporting
Water Quality Trends
Determining long-term trends is an excellent measure to evaluate changes in water quality and determine the effectiveness of water management programs. Long-term trends in New Jersey are showing improving conditions for nutrients and metals, degrading conditions for TDS and chlorides, while biological conditions are mostly stable.
Learn more by going to the Integrated Reports section Statewide Trends under the Statewide Water Quality tab.
In the effort to optimize resources for restoration efforts, the DEP has initiated actions that identify and prioritize future nonpoint restoration efforts at a regional level. The goal of this effort is to maximize the utilization of restoration funding by identifying AUs that show the best potential for improving water quality and prioritizing these efforts.
The identification and prioritization of NPS restoration AUs involves a comprehensive assessment process and the results from the Recovery Potential Screening (RPS) tool.
The Departments utilization of the RPS tool is the first step in the prioritization process, as it provides a ranking system on which the rest of the process can be based. The RPS tool works on a series of weighted inputs. Local impacts or possible pollutant sources are inputs to the RPS tool and include: point and nonpoint sources (such as NJPDES discharge, contaminated sites, landfills, and golf courses), land use loading associated with agriculture, urban, impervious surfaces and others, and riparian zone and habitat conditions. Restoration and protection accomplishments are also inputs to the RPS tool and include: C1 designated waters, TMDLs, restoration projects, and preserved open space areas. The RPS tools analysis requires input layers to be split into 3 categories (e.g., ecological, stressor, and social indicators). Each input layer is also weighted based on their relative effects on general water quality within New Jersey. Each watershed subsequently received an RPS score for watershed comparison.
Based on RPS tool results, water quality and biological data are then reviewed for identification of assessment units that are considered on the bubble of impairment status. These watersheds contain waterbodies that seem close to fully supporting water quality criteria. The AUs are identified by verifying improving trends, determining the magnitude and frequency of exceedances of the criteria, identifying recent delistings from the 303(d) List and identifying other pollutants that are fully supporting in the watershed.
The use of NJs custom version of EPAs RPS tool offers a flexible, user-friendly, technically-based, and rapid approach to identify and prioritize watersheds for restoration and protection. The RPS is an Excel-based tool that provides a relative ranking of watersheds based on their condition and how well they may respond to management efforts.
Delaware Region Restoration Priorities
For the Lower and Upper Delaware Water Regions combined, 55 HUC14 watersheds were selected. A significant number of headwaters and tributaries were selected. These waters were characterized by water quality data near or trending toward the criteria, healthy biological communities nearby, watersheds with a limited number of identified sources and causes, sufficient undeveloped land use, and intact or limited development in the riparian zones. It is expected that restoration efforts with achievable scopes and funding can make the changes needed in these watersheds to restore water quality not only in the headwaters and tributaries but as a collective effort downstream for the larger rivers.
Restoration Priority Assessment Units Upper Delaware
Restoration Priority Assessment Units Lower Delaware
Total Maximum Daily Loads (TMDLs)
Impaired AUs with TMDLs. (Darker colors indicate number of TMDLs in the AU)
TMDLs are an important tool to begin to restore our impaired waterbodies by identifying measures needed to reduce the pollutant loads from pollutant sources.
To date, the Upper Delaware and Lower Delaware Water Regions include 34 TMDL reports to address total phosphorus, total suspended solids, fecal coliform, total coliform, mercury in fish tissue, arsenic, volatile organic compounds, polychlorinated biphenyls (PCBs), and temperature water quality impairments. The TMDLs reports cover 277 parameter-HUC combinations and a significant portion of the total Delaware Water Region watershed area. The DEP is currently working closely with the Delaware River Basin Commission (DRBC) and USEPA on a revision of the PCB TMDL for the mainstem Delaware River which will further decrease loads of this legacy pollutant entering the river, bay and estuary.
As a result of TMDL implementation, the many water pollutant control programs, directed restoration funding, and numerous partnerships are continuing to improve water quality to resolve these waterbody impairments. Currently, the DEP is in development of TMDLs in the Delaware Water Region for chloride and total dissolved solids impairments, and is working closely with the DRBC to evaluate further dissolved oxygen improvements in lower portions for the Delaware River.
TMDLs Upper Delaware
WMA 01
WMA 02
WMA 11
TMDLs Lower Delaware
WMA 17
WMA 18
WMA 19
WMA 20
Arsenic
10
Arsenic
Enterococcus
Enterococcus
1
Escherichia coli
41
18
12
Escherichia coli
22
22
4
10
Fecal Coliform (Shellfish)
Fecal Coliform (Shellfish)
24
Mercury in Fish Tissue
17
1
5
Mercury in Fish Tissue
13
13
5
6
PCB in Fish Tissue
PCB in Fish Tissue
2
5
9
Phosphorus (Total)
6
4
6
Phosphorus (Total)
7
13
9
Category 1 Waters
The DEP recently adopted amendments to the SWQS, that upgraded the antidegradation designation of approximately 670 river miles to Category One (C1) on March 4, 2020. Approximately 62 percent or ~413 river miles of the most recent protected stream are in the Upper and Lower Delaware Water Regions. To date, 7,436 river miles have been classified as C1; or ~38% of NJ waters. An additional 15% are Outstanding National Resource Waters (FW1 and PL) in NJ which also have strong protections.
Protections for the Upper Delaware and Lower Delaware Water Regions comprise 33% of the total C1 protected streams. 40% of the Upper Delaware waters are C1 or FW1, while the Lower Delaware has only 14% C1 or FW1 protected waters. The recent new protections include portions of the Salem River, Muddy Run, Green Branch, Paulins Kill, Swartswood Creek, Pequest River, Blair Creek, and many other waters.
Nonpoint Source Restoration Projects
The NJDEPs Statewide Nonpoint Source Management Program is implemented cooperatively with many other water quality programs along with other State agencies, including the New Jersey Department of Agriculture, local governments and the watershed associations. This program combines regulatory controls, non-regulatory strategies, watershed-based plans, restoration actions, and targeted funding to address NPS pollution on a scale that ranges from statewide to individual watersheds or sources of NPS.
There are 9 Watershed Based Plans (WBPs) in the Upper and Lower Delaware Water Region. These plans outline projects and pollutant reductions in the Alexauken Creek, Assiscunk Creek, Clove Brook, Mulhockaway Creek, Musconetcong River, Papakating Creek, Upper Cohansey River, and Upper Salem River that are designed to restore water quality. These WBPs were completed through NJDEP and USEPA grants to regional planning partners. The DEP has prioritized implementation project funding in alignment with these WBPs.
Since 2000, the Department has completed at least 115 nonpoint source restoration projects in the region totaling over $4.75 million. These projects have included WBP development, streambank restoration, riparian buffer restoration, lake restoration, livestock control, stormwater controls including detention basin retrofits, agricultural and urban green infrastructure, impervious surface, and manufactured treatment devices. Recent efforts in the Delaware Regions has resulted in $5.2 million for new projects since 2015.
Recent DEP Funded Nonpoint Restoration Projects in the Upper and Lower Delaware Regions 2015-2019
Applicant / Project Name
Funding Allocation
Affected Waterbody
Parameters Addressed
Project Description
Year
Camden MUA, Green Infrastructure for Gateway Park; Camden and Pennsauken
$65,000
Delaware and Cooper Rivers
CSO discharge reduction
Green infrastructure will be installed in Gateway Park, the 25-acre stretch of primarily grass park land that lies in Camden and Pennsauke. Restoration of natural habitat is one of the components of the park creation, and the proposed three bioswales and tree plantings will provide habitat to serve as relieve to stormwater impacts.
2015
Partnership for the Delaware Estuary, Expansion of Bio-Based Living along the Maurice River
$340,000
Maurice River
Nutrients, Turbidity, Pathogens
Install up to 10 new living shoreline cells in proximity to earlier installations to maximize shellfish and vegetation mediated WQ enhancement (TSS, nitrogen, phosphorous filtration).
2016
Rutgers and Camden SCD (combined) Green Infrastructure for Gloucester City and Camden City
$430,000
Delaware River, Newton Creek
CSO discharge reduction
Gloucester City has seven (7) CSOs that discharge to the Delaware River and Newton Creek. Implement broad ranging green infrastructure practices targeting disconnection of 15-50 percent of the impervious cover within the North Camden neighborhood, identified by CamdenSMART as a target area ready to embrace green infrastructure.
2016
Rutgers University Green Infrastructure City of Trenton
$370,000
Delaware River, Assunpink Creek
CSO discharge reduction
This project will focus on priority environmental issues identified by the community including efforts to better manage vacant properties, reducing nonpoint source water pollution, reducing nuisance flooding, addressing the impact of brownfields on community health, and upgrading aging infrastructure.
2016
Environmental Justice Project for the Lower Assunpink Creek, Broad Street Culvert, City of Trenton ($0)
$3,200,000
Delaware River, Assunpink Creek
Phosphorus, TSS
The City of Trenton has been working diligently with the Army Corps of Engineers for many years to daylight a portion of the Assunpink Creek between Broad Street and Warren Street. This grant is to continue the work and complete the project.
2016
The Trust for Public Land - Implementation of GI in Dominick Andjar Park, Camden City
$400,000
Cooper River
TSS
The objective of this project is to capture stormwater runoff before it enters the combined sewer system. The project will create low-maintenance grassy bioswales, a stormwater basin, stormwater tree trenches, and a flood-capturing soccer field at Cominick Andjar Park, Camden.
2017
NJ Audubon Society - Whole Farm Agricultural BMP's in Southern NJ
$450,000
Salem River and Cohansey River
TSS, TP, Pathogens
This project will implement no-till planting, multi-species cover crops, native vegetative buffers, livestock fencing, and stream crossing maintenance on each farm as needed. The goal will be achieved by working with at least 3 farmers in the Upper Cohansey River Watershed and 3 farmers in the Upper Salem River Watershed to adopt a whole farm approach.
2017
Examples of Completed Projects
Clove Brook Restoration BEFORE
Clove Brook Restoration AFTER
Bowers Brook Restoration BEFORE
Bowers Brook Restoration AFTER
Paulins Kill Restoration
Highlands Water Protection and Planning Act (Highlands Act)
The Highlands Act is a law signed in August 2004 that preserves open space and protects the State's greatest diversity of natural resources including the precious water resources that supply drinking water to more than half of New Jersey's families. The Highlands Act documents the geographical boundary of the Highlands Region and establishes the Highlands Preservation Area and the Highlands Planning Area.
The Highlands Act advocates for a regional approach to land use planning, requiring stringent resource protection policies while acknowledging that development, redevelopment, and economic growth in certain appropriate areas of the Region were also in the best interests of the state. The New Jersey Highlands Water Protection and Planning Council (Highlands Council) is a regional planning entity established in the Highlands Act and charged with its implementation. The Highlands Council works in partnership with municipalities and counties in the Region to encourage a comprehensive regional planning approach to implementation of the Highlands Act. Implementation is guided by the Highlands Regional Master Plan (RMP), adopted by the Council in 2008.
Area covered by the Highlands Act in New Jersey
Delisting From 303(d) and Sublist 4
The DEP documents improvements in water quality through the delisting of impaired waters from the 303(d) List and Sublist 4. Delisting may be based on new data, approved TMDLs, or corrections to previous listings. Water quality improvements are only valid where new data confirms full support.
In the Lower Delaware, new data has confirmed 24 AUs showing improvements, while the Upper Delaware has 21 AUs with improved water quality.
NPS Success Stories
NPS success stories highlight waterbodies identified as being primarily nonpoint source-impaired and having achieved documented water quality progress.
Many of the success stories in the state are located in the Upper Delaware Region. Click on the map to learn about these achievements in the Wallkill River, Pequest River, Paulins Kill, and Cooper River (not shown on map).
Water Quality Trends
Determining long-term trends is an excellent measure to evaluate changes in water quality and determine the effectiveness of water management programs. The Lower and Upper Delaware Regions are both showing improving trends for total phosphorus, while total nitrogen and nitrate have mixed results. Metal trends are excellent with a significant decrease in listing on the 303(d) List. Biological community trends have a wide disparity between the two regions with the Upper Delaware showing improving conditions while the Lower Delaware is worsening. TDS and chlorides are demonstrating worsening trends in both regions.
Learn more by going to the Integrated Reports section on the Delaware Region Trends under the Delaware Water Region Water Quality tab.
Click on the tabs below and left, for PROGRAMS and DESCRIPTIONS:
Total Maximum Daily Loads (TMDLs)
Total Maximum Daily Loads (TMDLs) represent the assimilative or carrying capacity of the receiving waterbody taking into consideration point and nonpoint sources of pollution, natural background water quality, and surface water withdrawals. A TMDL identifies the sources (point and nonpoint) contributing a pollutant of concern and sets load reductions needed to meet surface water quality standards. Waters that do not meet the applicable standards are placed on the 303(d) List of Water Quality Limited Waters (303(d) List). The 303(d) List is then ranked and prioritized for TMDL development.
Discharge to Surface Water Permits
The DEPs NJPDES Discharge to Surface Water (DSW) Program regulates the discharge of treated and untreated effluent from various municipal and industrial facilities directly into surface waters of the State (e.g., rivers, streams, ocean waters) via a point source. These facilities operate under the authority of an individual or general NJPDES permit that limits the mass and/or concentration of pollutants discharged. The NJPDES DSW permits establish technology- or water quality-based effluent limitations that limit the mass and/or concentration of pollutants discharged to levels that will not cause the receiving water to exceed applicable surface water quality standards.
Discharge to Ground Water Permits
The DEP regulates facilities that discharge sanitary and industrial wastewater to ground water under the NJPDES Discharge to Ground Water (DGW) Permit Program. The pollution control requirements contained in NJPDES discharge to ground water (DGW) permits are those conditions necessary to restrict the discharge of pollutants to ground waters of the State so that they do not exceed applicable ground water quality standards. The types of facilities regulated include: mines, pits and quarries; schools and hospitals; potable water treatment plants; large corporate office buildings; industrial manufacturing facilities; campgrounds and mobile home parks; food processors; and sewage treatment plants and other discharges of wastewater that can impact ground water, including the management of dredged materials at upland locations.
Stormwater Permitting
The Bureau of Stormwater Permitting is a part of the Division of Water Quality. It is responsible for controlling discharges of pollutants to surface water and ground water. The source of these pollutants is stormwater and industrial or sanitary wastewater.
Stormwater Management
The Stormwater Management rules (N.J.A.C. 7:8) provide the basis for municipalities to develop stormwater management plans and specify stormwater management standards that are mandatory for new major development. The rules require that 100 percent of the average annual ground water recharge be maintained for new development projects, to help mitigate future droughts and flooding.
Combined Sewer Overflow
The DEP is implementing a Statewide Combined Sewer Overflow Control Strategy consistent with the National Policy. As a first step, New Jersey has required its owners and operators of CSOs to develop and implement the Nine Minimum Control Measures (NMCs), specified in the National Policy. The CSO permit holders must capture and remove solids and floatables above a certain size at every CSO Point.
Coastal Management
The Coastal Management Program defines goals and standards for the purpose of integrating protection and enhancement of natural resources, appropriate land use and development, and public access to, and use of, New Jerseys coastal resources. The program addresses some of todays most pressing coastal issues, including sustainable and resilient coastal community planning, climate change , ocean planning, and planning for energy facilities and development.
Coastal Nonpoint Source Pollution Control
The Coastal Nonpoint Source Pollution Control Program addresses NPS pollution in coastal waters. This program part of the federal program administered jointly by the USEPA and the National Oceanic and Atmospheric Administration (NOAA). The program describes how the State will implement NPS BMPs to reduce pollution associated with several sources such as agriculture, forestry practices, urban development, marinas and boating activities, hydromodification, and others.
Nonpoint Source Management
New Jerseys NPS Management Program is implemented cooperatively with many other Department programs along with other State agencies, including the New Jersey Department of Agriculture, local governments and watershed associations. The program combines regulatory controls, nonregulatory strategies, watershed-based plans and restoration actions, and targeted funding to address NPS pollution on a scale that ranges from statewide to individual watersheds or sources of NPS.
Water Quality Restoration Grant
Awarded by the DEP to fund watershed restoration activities and initiatives that address nonpoint source pollution. Funding sources include USEPA pass-through grants issued under Section 319(h) of the federal Clean Water Act (CWA), Natural Resource Damages (NRD) recoveries, Corporate Business Tax (CBT) funds as well as other federal and State funds that may be available for NPS-related water quality restoration activities. Generally, grants are focused on restoring priority water bodies impaired predominantly by nonpoint source pollution where the grant will help implement an approved TMDL or WBP.
Agriculture Nonpoint Source Pollution Control
The DEP fosters a partnership with the New Jersey Department of Agriculture (NJDA), the United States Department of Agriculture - Natural Resources Conservation Service (USDA-NRCS), and other agricultural organizations to achieve New Jersey's water quality goals. In some of New Jersey's more rural watersheds, agricultural land uses are the major nonpoint source of pathogens and nutrients. Implementing best management and conservation practices on agricultural lands is an important component of New Jersey's nonpoint source pollution control strategy because it will improve water quality, conserve water and energy, prevent soil erosion, and reduce the use of nutrients and pesticides.
Farm Bill Funding
The USDA-NRCS provides technical and financial assistance to help farmers, ranchers, and forest landowners conserve soil, water, air, and other natural resources. All programs are voluntary and offer science-based solutions that benefit both the landowner and the environment. NRCS provides conservation technical assistance through their staff at NRCS Field Offices and through NRCS certified Technical Service Providers, in cooperation with New Jersey's fifteen Soil Conservation Districts and the New Jersey Association of Conservation Districts. Other key partners include the NJDA, Rutgers University, and other State and Federal Agencies. New Jersey receives funds under the Farm Bill that are administered through the following USDA voluntary programs for eligible New Jersey landowners and agricultural producers.
New Jersey Water Bank
The NJWB provides loans to local government units for the construction of wastewater treatment facilities, sludge management systems for wastewater and water treatment systems, combined sewer overflow abatement, stormwater, and other nonpoint source management projects. The financing program also provides loans to both publicly, privately, and nonprofit noncommunity owned drinking water systems for the construction or upgrade of drinking water facilities, transmission and distribution systems, storage facilities, and source development. The Trust issues revenue bonds which are used in combination with zero percent interest funds to provide very low interest loans for water infrastructure improvements.
Green Acres / Blue Acres
As the principal land acquisition agent for the DEP, Green Acres acquires land for state parks, forests, natural areas, and wildlife management areas. The Program also provides matching grants and low interest (two percent) loans to municipal and county governments, and matching grants to nonprofit organizations to acquire open space and develop outdoor recreational facilities. While the protection of water resources through land preservation has been a goal of Green Acres since its inception, the legislation further focuses Green Acres preservation efforts on lands that protect important water resources. In addition, Blue Acres acquires properties (including structures) that have been damaged by, or may be prone to incurring damage caused by, storms or storm-related flooding, or that may buffer or protect other lands from such damage.
Wetlands
New Jersey has taken a multi-faceted, comprehensive, approach to managing and protecting freshwater and coastal wetlands and developed the New Jersey Wetland Program Plan. The steps outlined in the plan will serve to direct current and future wetland protection and management efforts along a coordinated path to the benefit of New Jerseys wetland resources and the quality of life for future generations. The DEP, in collaboration with Rutgers University, has been undertaking research focusing on quantitative wetland biological assessment methods. A goal of this research is to explore development of a wetlands index of biotic integrity (IBI) for New Jersey.
Regional Water Quality Initiatives
A number of regional initiatives have been formulated to address water resources important to the State. Planning, regulatory, and non-regulatory measures aim to identify and respond to water quality issues in each region:
The DEPs Division of Water Compliance and Enforcement is responsible for ensuring compliance with the State's water programs, with a particular focus on inspections of wastewater discharge and drinking water supply facilities. The DEP employs site inspections and detailed reviews of reported information to ascertain compliance and takes administrative actions, levies penalties, and where necessary, works cooperatively with criminal prosecutors, to ensure compliance.
Land Resources Protection
Managing New Jerseys land is a critical function of the DEPs overall environmental protection strategy. In recognition of the intimate tie between land use and the health and quality of our streams, estuaries, coastal waters, wetlands, wildlife habitat and our drinking water, the Division of Land Resource Protection regulates land use activities through a permit process in accordance with the rules promulgated in support of the following statutes: Freshwater Wetlands Protection, Flood Hazard Area Control Act, Wetlands Act of 1970, Coastal Area Facility Review Act, Waterfront Development Law, Tidelands Act, NJ Water Pollution Control Act, and the Highlands Water Protection and Planning Act.
Air Pollution Control
NJDEP manages air quality with ambient air monitoring, inventories of sources, emission reduction plans, rules, permits, air quality modeling and risk assessment, vehicle inspections and voluntary programs to modernize fleets and promote electric vehicles. The Air Compliance and Enforcement program ensures compliance with the Air Pollution Control Act by provides compliance assistance, investigates complaints, conducts inspections, collects samples and gathers evidence, issues enforcement documents, negotiates compliance schedules and penalty settlements.
Climate Change
New Jersey is working to address and mitigate the impacts of climate change. The State is surging forward toward its goal and is accelerating its transition to a low carbon economy through reducing its carbon pollution, expanding its clean energy infrastructure and building resilient communities.
NJs goal is by 2050 achieve a 80% reduction of greenhouse gases from the 2006 baseline.
Community Water Monitoring
An important element of non-regulatory NPS control is the cumulative effect of the actions of citizens within their communities. Citizens practice water conservation and participate in stream walks, beach cleanups, and other environmental activities sponsored by community-based organizations. By helping out in such efforts, citizens address New Jerseys largest water quality problem, nonpoint source pollution, advancing the goal of making more of our rivers, lakes, and coastal waters safe for swimming, fishing, drinking, and aquatic life.
Americorps NJ Watershed Ambassadors
By working with local communities, the AmeriCorps New Jersey Watershed Ambassadors Program (NJ WAP) promotes capacity building by raising public awareness about water quality and watershed issues through direct community involvement. AmeriCorps members are each assigned to one of New Jerseys 20 Watershed Management Areas (WMA) and work with host agencies to serve as "Watershed Ambassadors" to their watershed communities.
Water Quality Assurance
The Office of Quality Assurance (OQA) administers the DEP's Quality Assurance Program, which is required by USEPA to ensure that environmental data used by the DEP is generated, compiled, and reviewed using specific quality assurance/quality control (QA/QC) procedures. OQA is responsible for developing and implementing the DEPs Quality Management Plan (QMP), which defines the DEP's mission and planned quality assurance work outputs for the forthcoming fiscal years. OQA is also responsible for certifying that the laboratories that analyze data used by the DEP operate using appropriate quality control measures and analytic methods.
Impacts of Climate Change on Water Quality
Potential Impact
Anticipated Effect on Water Resources
Changes in Temperature:
Changes in the distribution and survival of aquatic species, algal blooms, and lower dissolved oxygen levels
Changes in Precipitation:
• Reduced groundwater and surface water supply in some areas
• Reduced reliability of snow pack to replenish reservoirs and aquifers
• Droughts
• Wildfires
• Increased water demand due to higher temperatures
• Increased runoff resulting in erosion and sedimentation
• Displacement of coastal wetlands and habitat
• Increased coastal erosion
• Salt water intrusion in drinking water supplies
• Inundation of wastewater treatment infrastructure
Ocean and Coastal Changes:
• Biological habitat changes as the air temperatures increase
• Estuarine waters become more saline as sea levels rise
• Ocean temperatures increase
• Ocean acidification
In 2020, the DEP led a comprehensive effort to synthesize the latest and most reliable scientific information on the current and predicted future impacts of climate change on the state1. According to the report, New Jersey has seen evidence of climate change in its increasingly mild winters, more intense rainfalls, flooding along inland streams and rivers, and more tidal flooding along the coast. These events can threaten public health and safety, destroy property, undermine critical infrastructure, and damage New Jerseys economy, including the vibrant tourism industry. As New Jerseys Scientific Report on Climate Change explains, data indicates that as atmospheric levels of carbon dioxide and other greenhouse gases increase, New Jersey will experience significant direct and secondary changes in its environment. These include increases in temperature, variability in precipitation, frequency and intensity of storms, sea-level rise, ocean acidification and the associated impacts to ecological systems, natural resources, built environments, human health and the economy.
One of the areas of focus was water quality and quantity. Climate impacts on these are such that:
Periods between rain events may be longer, causing drought conditions more frequently, increasing potential for reduced water supply availability, reductions in agricultural capacity that lead to shortages in food production and increased prices, and economic loss from impacts to livestock, and reductions in hydroelectric power production.
New Jerseys agricultural yields could suffer as water supplies are stressed from an expanded growing season, while some crops may not thrive in warmer temperatures.
Climate change implications for water resources are complex. Higher temperatures will increase evaporation (from surfaces) and transpiration (from plants), as will a longer growing season. Stream flows rely heavily on flows from ground water, which in turn rely on recharge rates that could change either for the better (in response to more precipitation and longer frost-free periods) or for the worse (in response to competition from vegetation during a longer growing season, and more precipitation going to runoff due to more intense storms). While more precipitation is possible, more frequent short droughts are as well. Increased temperatures also change water chemistry and quality, as will more severe storms, complicating the protection of water supplies. The net effect is likely to be a greater variability in water availability2. Improved management approaches will be needed to ensure sufficient supply of sufficient quality. Water supply management should be based on projected scenarios, not a repeat of past conditions, and additional research on the implications of hydrologic changes will be needed, with the results linked back into the scenario development process.
Sources:
1 NJDEP. New scientific report details climate change impacts on New Jersey, supports Murphy Administration effors to protect the state's environmental, public and economic health.; 2020. https://www.state.nj.us/dep/newsrel/2020/20_0033.htm
Harmful Algal Bloom (HAB) is the name given to the excessive growth or bloom of cyanobacteria which can produce one or more types of potentially harmful toxins. HABs can occur in fresh and marine water under suitable environmental conditions of sunlight, temperature, nutrients, and calm water. These blooms often result in a thick coating or mat resembling pea soup or spilled paint on the surface of a waterbody, often in late-summer or early fall. A HAB can be dangerous to people, animals or the entire ecosystem and some can produce chemicals that can be toxic to humans and animals if ingested, inhaled, or if contacted by skin or mucous membranes. The effects of any contact can include allergic reactions, gastroenteritis, rash, flu-like symptoms, and other irritations. There is limited information whether these toxins can accumulate in fish and shellfish. However, it is cautioned to not consume fish or shellfish when a HAB is present.
The DEP has developed the capacity to perform enhanced monitoring and analysis of these toxins as well as response strategies for advisories and actions in both freshwater and marine water. For freshwater, observed blooms undergo a field screen with a handheld fluorometer or microscopic confirmation. Once the presence of cyanobacteria is determined, additional samples are collected for the laboratory and a monitoring plan will be implemented for that site. The DEP recently published the New Jersey Cyanobacterial Harmful Algal Bloom (HAB) Response Strategy, that provides a statewide approach to responding to cyanobacterial HABs in freshwater recreational waters and sources of drinking water.
In marine waters, the DEPs Algal Bloom Monitoring Program has been conducting phytoplankton monitoring to ensure safe shellfish harvesting. There are two components to the monitoring program including phytoplankton monitoring at fixed station and aircraft remote sensing for chlorophyll during the summer. The fixed monitoring network gives a representative overview of the estuarine waters of New Jersey and 45 stations are sampled year-round for HABs. The aircraft remote sensing conducts 6 flights a week and identifies algal blooms in coastal waters.
When areas of concern are detected, samples are then taken to determine if cyanobacteria are present. As part of the State's compliance with the National Shellfish Sanitation Program (NSSP), the DEP is required to develop a Biotoxin Contingency Plan that includes control measures for marine biotoxins.
The DEP has employed the use of continuous monitoring buoys in Lake Hopatcong and Manasquan River. An additional 10 buoys will be installed in Spring 2021 at assorted lakes, in addition to our seasonal lake flights to collect additional information in the formation of recurring blooms.
Over the last several years, the DEP has made significant strides in understanding HABs, educating the public and developing tools to address these blooms. This information may be found on the DEPs website at the link below.
Long-term water quality monitoring data show a trend of increasing chloride and total dissolved solids (TDS) concentrations in NJ surface waters. Elevated chloride and TDS directly impact aquatic life (including macroinvertebrates, fish and amphibians) and human health, while chloride can also indirectly affect human health by increasing water corrosivity that can lead to unhealthy levels of metals in drinking water.
TDS and chloride increases are associated with runoff from urban and agricultural areas as well as discharges from wastewater treatment facilities and septic systems. In the winter, runoff of salt used to control ice on roadways can be a serious problem, and NJs salt use for road deicing is growing.
Data from the DEPs year-round Ambient Surface Water Quality Monitoring Network (ASWQM) show increasing trends in median concentrations of dissolved chloride and TDS. The number of samples which exceed New Jerseys surface water quality standards (SWQS - N.J.A.C. 7:9B) for chloride and TDS is also increasing. Most of the increases (69% of TDS samples over 500 mg/L and 85% of chloride samples over 230 mg/L) occur in our cold weather months (November through April).
The data reviewed to develop NJs Integrated Report identified 39 assessment units with use impairments due to exceedances of SWQS for TDS and 8 assessment units with use impairments due to chloride. Most of the impaired assessment units are in the Piedmont physiographic region and have relatively high levels of impervious surface, although the increasing TDS and chloride trends were found in all areas.
NJDEP Continuous Specific Conductivity Monitoring Project
Specific conductance (which correlates with the sum of dissolved major ion concentrations in water) is strongly correlated to TDS and chloride, and easily and accurately measured in the field. Beginning in 2011, NJDEP deployed continuous specific conductance data loggers in a total of 41 non-tidal freshwater streams with varying levels of urbanization. Continuous specific conductance data showed substantial increases with significant snowfall events. Based on these recordings, winter levels are much higher than previously thought and the continuous identified peaks and durations of elevated chloride and TDS concentrations.
Management of Road Salt Impacts
The DEP has developed required and recommended best management practices as part of its municipal stormwater regulation program (MS4 link) to reduce the use and impact of deicing materials. Additional guidance documents are available for highway agencies. In addition, the DEP has a Snow Removal and Disposal Policy that prohibits the dumping of snow in waterbodies, wetlands, stormwater basins etc. except with an emergency permit from the DEP. A Water Quality Restoration Program grant awarded to Brick Township Municipal Utilities Authority aims at reducing road salt impacts, through development of a winter road de-icing best management practices report, workshop and pilot municipal demonstration project.
Currently, the DEP is compiling road salt usage and loading trends and reviewing other states approaches to reduce road salt impacts, including TMDLs and BMPs. These efforts will be in the DEPs technical and implementation approach to further address this water quality problem.
Perfluorooctanoic acid (PFOA) and perfluorooctanesulfonic acid (PFOS) are part of a larger group of chemicals called per- and polyfluoroalkyl substances (PFASs) that have been widely produced and used industrially and commercially. Both PFOA and PFOS may be found in consumer products, such as stain resistant coatings for upholstery and carpets, water resistant outdoor clothing and grease-proof food packaging. PFOA may be used in the manufacture of non-stick cookware, and PFOS is used in Aqueous Film Forming Foam (AFFF, used for fighting petroleum-based fires), metal plating and finishing. Although the production of PFOA and PFOS has ceased in the United States, contamination from PFASs is expected to continue due to their strong persistence in the environment.
PFASs have been detected across various environmental media and in drinking water supplies, and they pose serious threats to wildlife and humans. Compounds in this group bioaccumulate and can cause adverse health effects at low levels since the toxicity persist in the body for many years. PFOS has been shown to accumulate to levels of concern in fish, and some states have issued fish consumption advisories for certain waterbodies. New Jerseys fish consumption advisories document this concern in the DEP 2020 Fish Smart, Eat Smart guide.
Recently, two large-scale Department studies evaluated the occurrence of PFASs in surface and ground water sources, and in treated-water of public water systems. Both reports document how pervasive these pollutants are, as measured by water quality sampling and analysis. Detailed information is available in the documents Investigation of Levels of Perfluorinated Compounds in New Jersey Fish, Surface Water and Sediment and Occurrence of Perfluorinated Chemicals in Untreated New Jersey Drinking Water Sources.
Along with the study of these pollutants, NJ became the first state to establish a drinking water standard for PFAS chemicals in 2018. Most recently, NJDEP adopted ground water quality standards and maximum contaminant levels (MCL) for PFOA and PFOS, effective June 1, 2020.
Within the NJDEP, several discharge regulation/remediation workgroups are investigating and working to reduce this class of concerning pollutant by source. Establishment of a Surface Water Quality Standard (SWQS) is planned in the near future, and NJDEP is surveying the regulated community, enhancing PFASs monitoring and developing reporting and management approaches to address public concerns. An economically feasible pollutant reduction method, as applied with similar persistent compounds, is to continue coordinated track-down of high contamination areas for isolation and pollutant removal from the environment.
The Department published the draft 2018/2020 303(d) List of Water Quality Limited Waters in the New Jersey Register on June 21, 2021 (53 N.J.R. 1511(a)) and posted the lists and web-based report on the Departments website. The public comment period ended on August 20, 2021. Seventy-four comments were received on behalf of ten entities. A summary of the public comments and agency responses is furnished below.
The Department revised the draft 2018 and 2020 303(d) Lists based on careful consideration of the comments received. The final 2018 303(d) List was submitted to USEPA on December 6, 2021 and the final 2020 303(d) List on December 15, 2021, for approval. USEPA approved the final 2018 303(d) List on December 15, 2021 and the final 2020 303(d) List on January 11, 2022.
The Departments submission of the final 2018/2020 Integrated Report to USEPA on December 6, 2021 and December 15, 2021 satisfies the requirements of CWA Section 303(d) and 305(b), as well as N.J.S.A. 58:11A-7 and N.J.A.C. 7:15-5.2. The Department published the final 2018/2020 303(d) List of Water Quality Limited Waters which was signed on May 12, 2022 in the New Jersey Register on June 20, 2022 (54 N.J.R. 1201(a)).
Public participation is an integral part of the Integrated Report. Opportunities for data submissions and comments on the Integrated Report are provided to ensure this science-based document is informed, comprehensive and transparent.
The DEP provides several avenues for announcing its intent to seek water quality data and public comments to the Integrated Report from the general public:
electronic announcement sent to subscribers of the DEPs Listservs
Water quality data submittals from organizations outside the DEP makes up a large percentage of total data used for the Integrated Report water quality assessments. All appropriate and readily available data collected in accordance with a Quality Assurance Program Plan (QAPP) approved by the DEP, EPA or USGS may be submitted by uploading into the following data systems:
other publicly available databases may be used if WQDE, WQX and NWIS does not support the data type such as continuous water quality data, fish tissue data, or beach closure data. The DEP requests that data submitters contact the DEP which data system contains their data.
The DEP provides opportunities for public review and comment submission for the Methods Document and Integrated Report before they are published. The Comment Period for all documents are for a minimum of 30 days after announcement in the New Jersey Register. The documents are available on the DEPs Water Quality Assessment Website for review. After the public comment period closes, the documents are revised as needed to address comments and is submitted to USEPA for formal approval. All responses to the comments are submitted with the final document.
Comments may be submitted by:
electronically through email, (highly encouraged)
regular mail,
over the phone,
in person.
If you have any questions, comments or requests for information, please contact us.
Contact Us
Email: NJIntegratedReport@dep.nj.gov
Phone: 609-633-1441
Address: Bureau of Environmental Analysis, Restoration and Standards
Division of Water Monitoring and Standards
401 E. State Street
PO Box 401
Trenton, NJ 08625
It is important for New Jerseys aquatic ecosystems to flourish and persevere. Aquatic ecosystems provide several long-term economic benefits to society, including ecosystem services such as:
providing water -related activities such as recreational swimming, boating, and fishing;
generating income by commercial fisheries, including shellfish, and the seafood industry;
creating economic benefits generated by jobs, housing, retail sales, and tourism associated with these industries.
Good water quality provides economic benefits associated with recreation, tourism, and marine industries, as well as the resultant tax revenues, and reduces the costs of treatment required to meet drinking water standards for potable water supplies; therefore, protecting, restoring, and maintaining water quality in all our waterways has a direct and positive impact on the States economy.
Annual Ecosystem Service Values for Aquatic Ecosystems in New Jersey
Ecosystem Type
Total Acres as of 2002
Ecosystem Service Value (2009 $/acre/yr)
Ecosystem Service Value (2009 $/yr)
Freshwater wetlands
814,479
$13,141
$10,703,270,530
Estuaries
455,700
$13,238
$6,032,469,106
Saltwater wetlands
190,520
$6,965
$1,326,936,744
Coastal shelf
299,835
$1,476
$442,455,715
Beaches/dunes
7,837
$47,879
$375,227,660
Open fresh water
86,232
$869
$74,939,057
Riparian buffers
15,146
$3,842
$58,190,205
Total
1,869,749
$19,013,489,018
1 NJDEP. Valuing New Jerseys Natural Capital: An Assessment of the Economic Value of the States Natural Resources. April 2007. https://www.nj.gov/dep/dsr/publications/Natural_Capital_Full%20Report.pdf. Table is based on data from Table 5 of this report. Dollar amounts were converted from 2004 to 2009 dollars using the change in the Consumer Price Index for All Urban Consumers published by the U.S. Department of Labors Bureau of Labor Statistics at http://www.bls.gov/cpi/.
These estimated values make it clear that water of a quality and quantity sufficient to support these ecosystems in a state of healthy functioning is an essential part of a natural environment that provides extremely large economic benefits to New Jersey.


 The antidegradation policies instituted by SWQS are divided into three tiers: Outstanding National Resource Waters (ONRW), Category 1 Waters (C1), and Category 2 Waters (C2). ONRW carries the highest protection and applies to FW1 (nondegradation) and PL (Pinelands) waters. ONRW waters must be maintained in their natural state. The only changes to water quality allowed are those that restore natural water quality. C1 waters are recognized due to their exceptional ecological, recreational, water supply, or fisheries significance. C2 waters protect designated uses and require improvements to waterbodies that do not meet standards. In all three tiers, designated uses and water quality must be maintained and protected, and impairments must be restored to standards.